


Enhance Report Clarity with Charts
Charts and graphs present complex report data in a visually intuitive way, making it easier for users to identify trends and patterns.
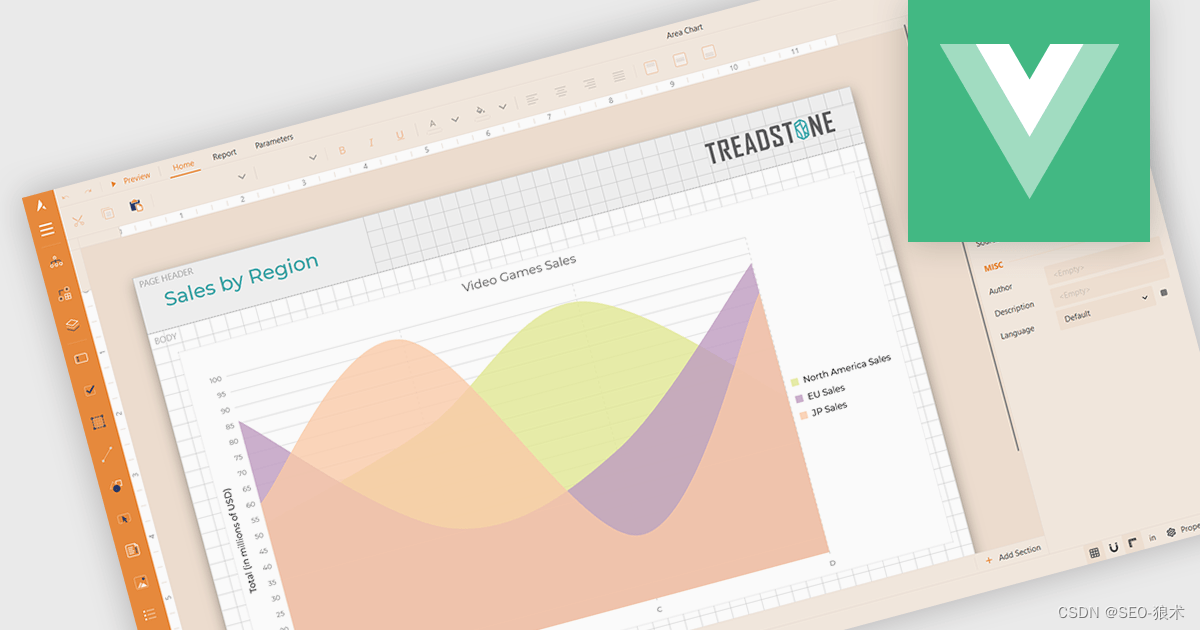
Charting support within a reporting component refers to the functionality that enables data visualization through charts and graphs. This integration offers several advantages for developers. By leveraging built-in charting capabilities, developers can streamline the reporting process, reducing the need for manual chart creation and improving report clarity and interactivity for end users. This not only saves development time but also fosters a more intuitive user experience for data exploration and analysis.


 3134
3134


 被折叠的 条评论
为什么被折叠?
被折叠的 条评论
为什么被折叠?
 到【灌水乐园】发言


