


目录
2.1.1 如何查看matplotlib内置样式:plt.style.available
2.1.2 如何使用matplotlib内置样式:plt.style.use('样式名称')
2.1.3 如何修改matplotlib内样式:设置rcparams
2.1.4 用户如何自定义样式:stylesheet.mplstyle
4.1 学习如何自定义colormap,并将其应用到任意一个数据集中,绘制一幅图像
一、 前言
这是该项目的最后一章。可以看到matplotlib的入门是十分简单的,介绍了几个常见的图像绘图后,再掌握一些“美观”的技巧就可以算入门。这最后一章着重点在样式和颜色。
二、 matplotlib的绘图样式(style)
(先导入所需要的库)
import matplotlib as mpl
import matplotlib.pyplot as plt
import numpy as np
plt.rcParams['font.sans-serif'] = ['SimHei']   #用来正常显示中文标签
在matplotlib中,要想设置绘制样式,最简单的方法是在绘制元素时单独设置样式。 但是有时候,当用户在做专题报告时,往往会希望保持整体风格的统一而不用对每张图一张张修改,因此matplotlib库还提供了四种批量修改全局样式的方式
2.1 matplotlib内置的样式
2.1.1 如何查看matplotlib内置样式:plt.style.available
print(plt.style.available)通过该代码,我们可以知道matplotlib内部提供了哪些样式:
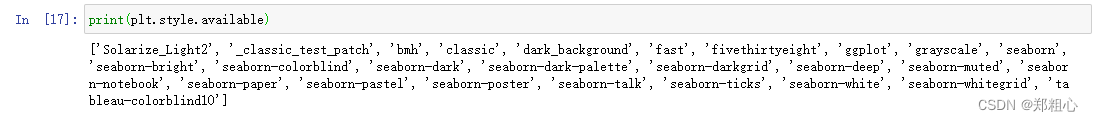
['Solarize_Light2', '_classic_test_patch', 'bmh', 'classic', 'dark_background', 'fast', 'fivethirtyeight', 'ggplot', 'grayscale', 'seaborn', 'seaborn-bright', 'seaborn-colorblind', 'seaborn-dark', 'seaborn-dark-palette', 'seaborn-darkgrid', 'seaborn-deep', 'seaborn-muted', 'seaborn-notebook', 'seaborn-paper', 'seaborn-pastel', 'seaborn-poster', 'seaborn-talk', 'seaborn-ticks', 'seaborn-white', 'seaborn-whitegrid', 'tableau-colorblind10']
2.1.2 如何使用matplotlib内置样式:plt.style.use('样式名称')
通过plt.style.use('样式名称')就行,具体查看下面代码:
x= np.arange(0,10)
y = np.arange(10,20)
fig = plt.figure(figsize=(6,3))
plt.style.use('default')
plt.ylim(0,20)
plt.title('title')
plt.plot(x,y);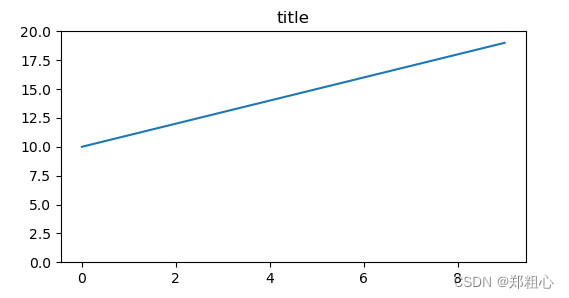
x= np.arange(0,10)
y = np.arange(10,20)
fig = plt.figure(figsize=(6,3))
plt.style.use('Solarize_Light2')
plt.ylim(0,20)
plt.title('title')
plt.plot(x,y);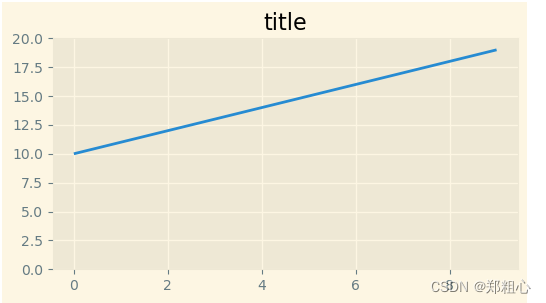
 最低0.47元/天 解锁文章


 4917
4917


 被折叠的 条评论
为什么被折叠?
被折叠的 条评论
为什么被折叠?
 到【灌水乐园】发言


