


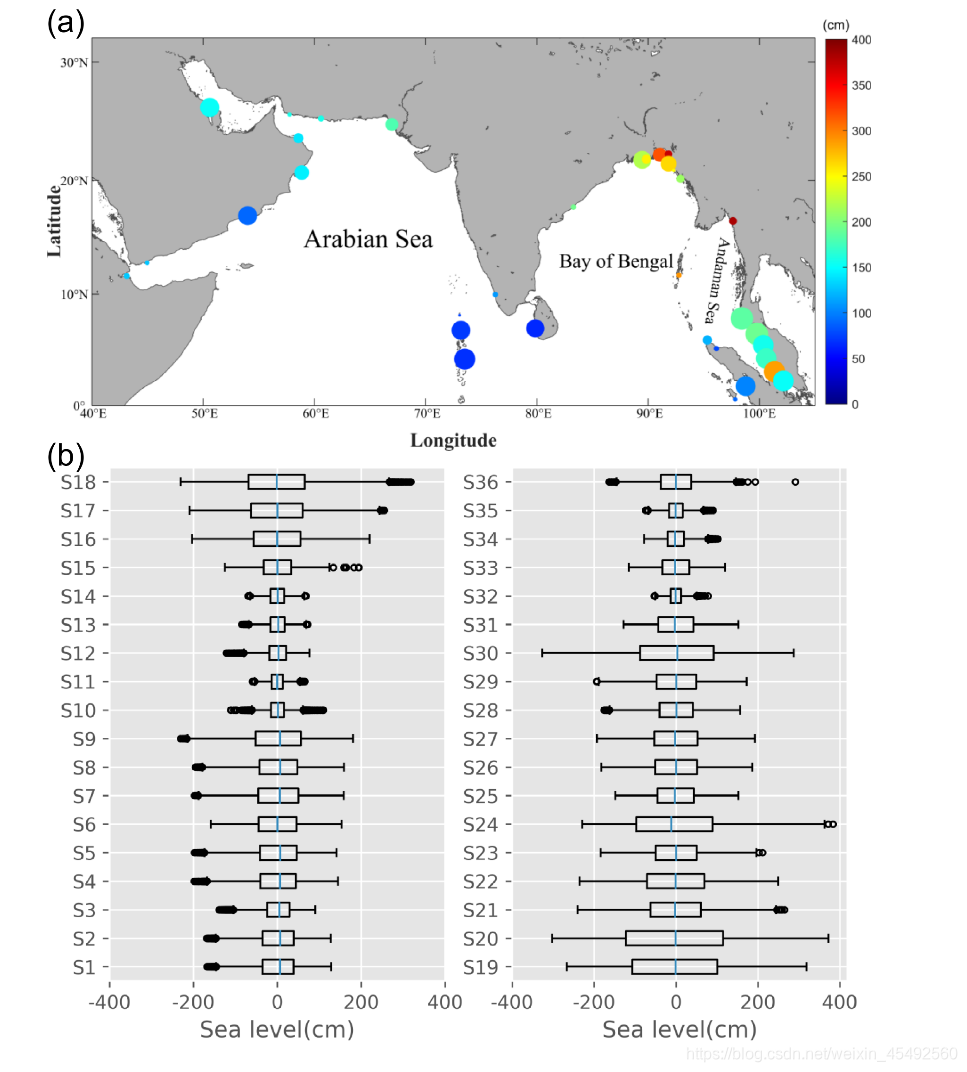
有2张图,需要将其合在一起显示
clc
clear
close all
path(path,'D:\new_matlab_Tool\matlab_tool_cwc\export_fig_v3')
%figure('position',[50 50 800 800])
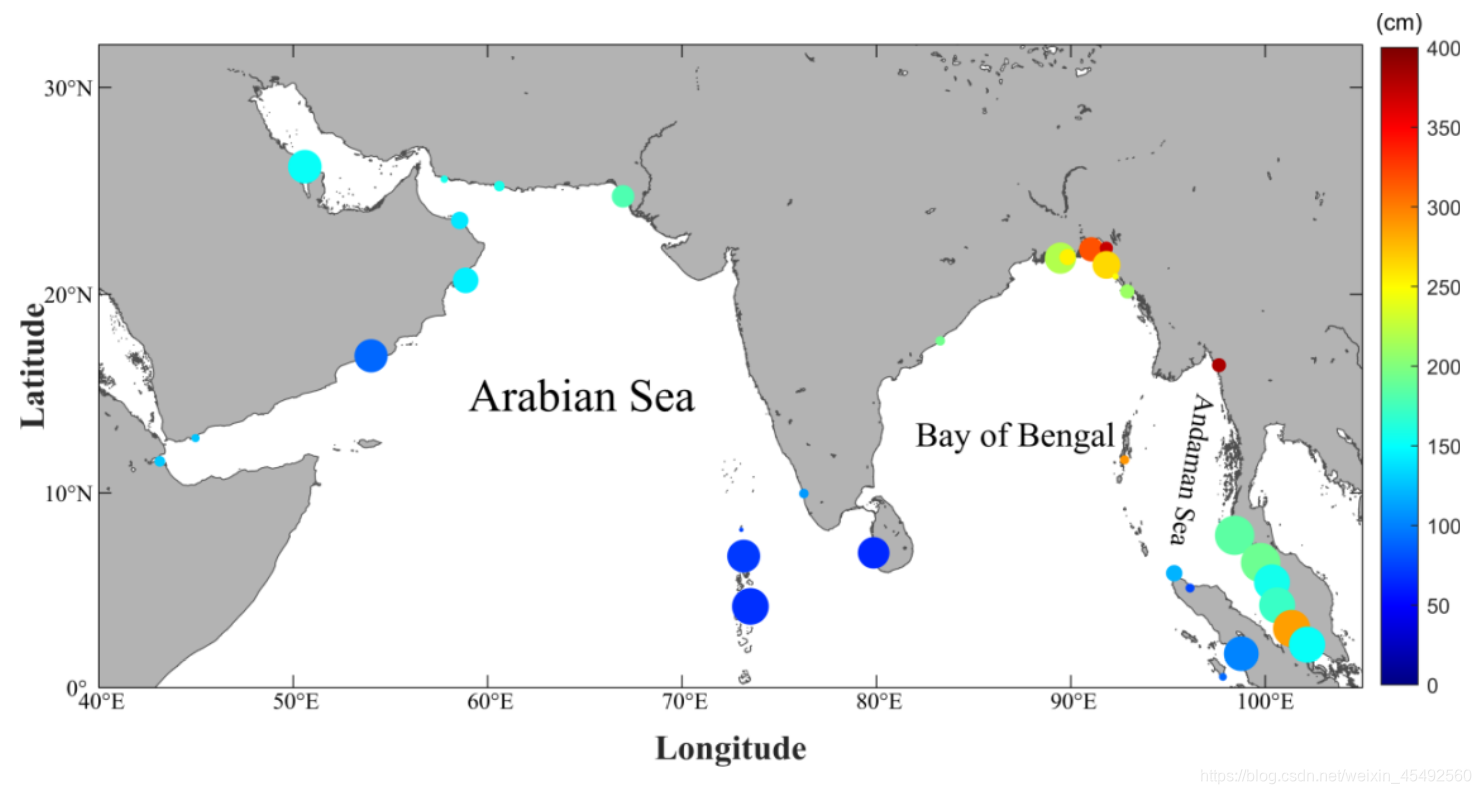
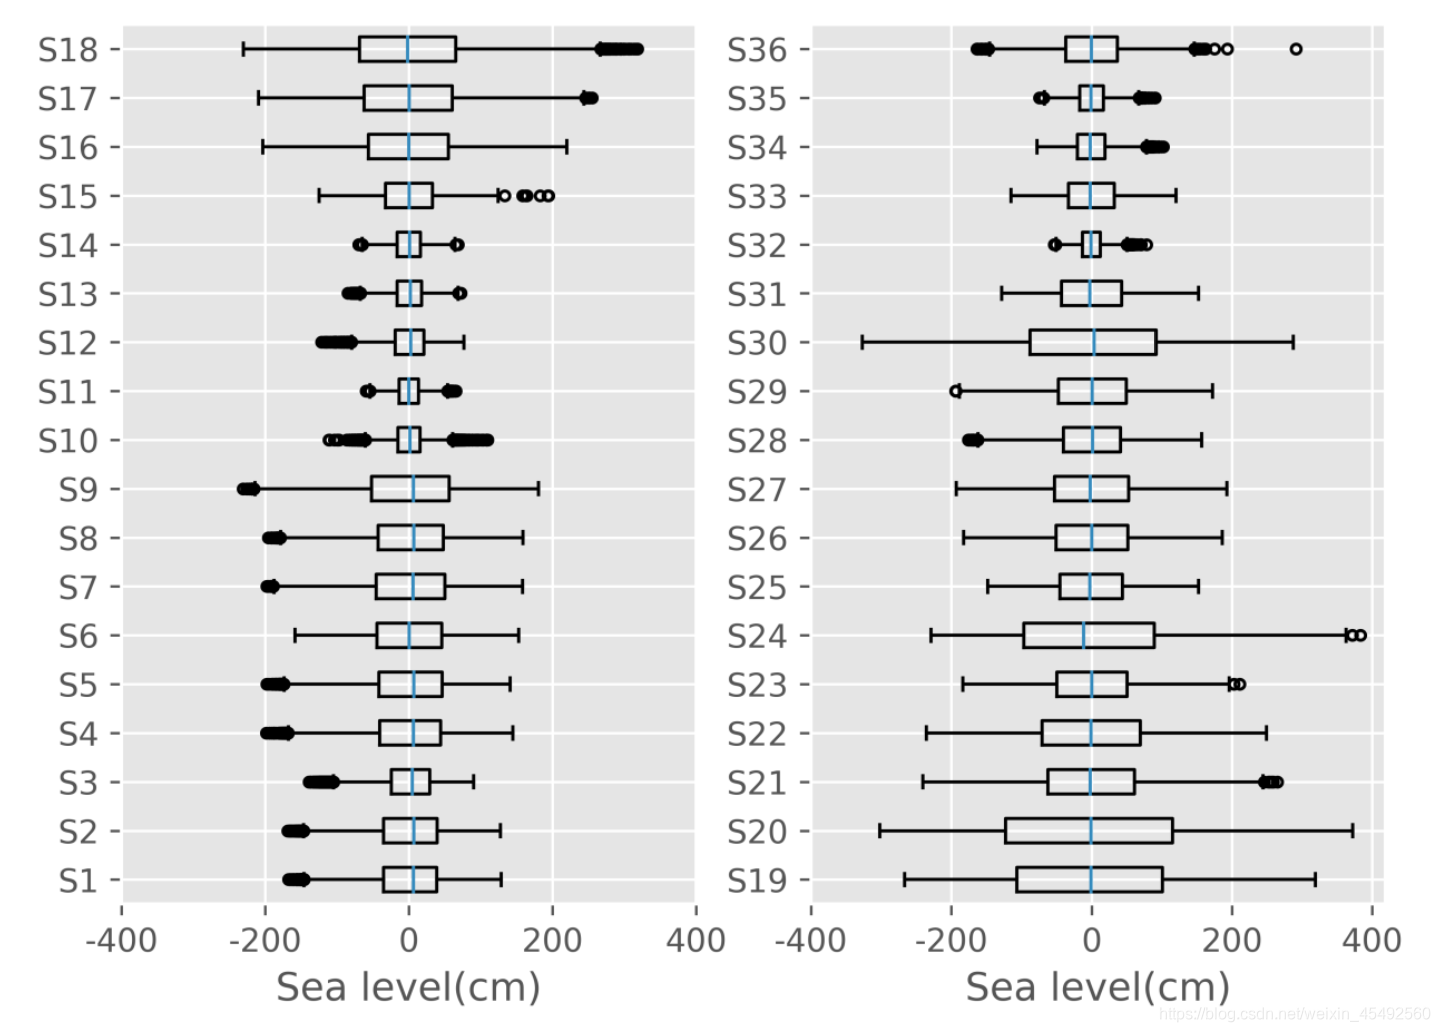
I = imread('1.png');
I1 = imread('2.png');
h1 = axes('position', [0.2 0.5 0.5 0.5], 'parent', gcf);
%位置
imshow(I, 'parent', h1);
text(0.1,0.5,'(a)','FontSize',8)
h2 = axes('position', [0.2 0.08 0.5 0.5], 'parent', gcf);
%位置
imshow(I1, 'parent', h2);
set(gcf,'color',[1 1 1]);
text(0.1,0.5,'(b)','FontSize',8)
export_fig(gcf,'png1_2','-png','-r1200')
最终效果见
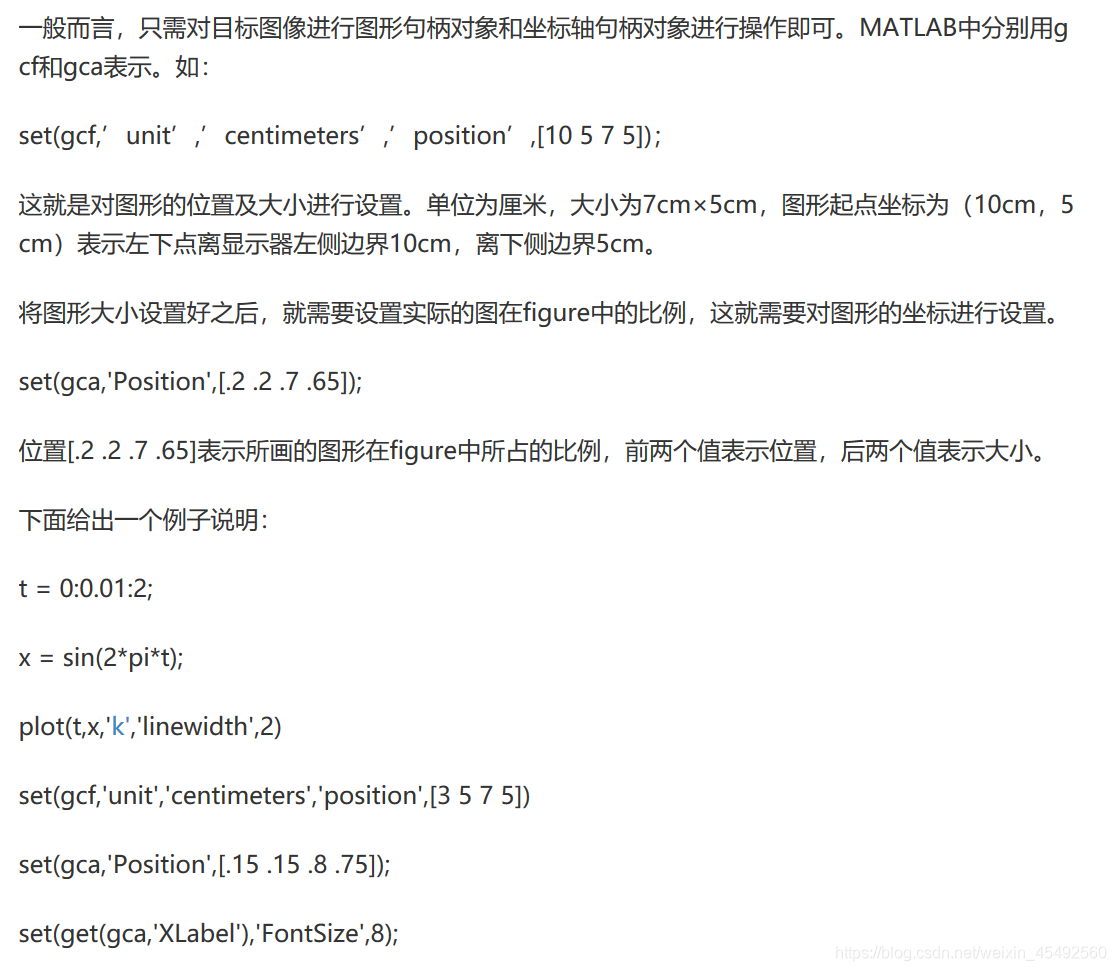
原理主要是通过图像的position调节
参考链接:https://blog.csdn.net/weixin_44401286/article/details/94729248
参考链接:https://blog.csdn.net/haha0216/article/details/52698757

参考链接:https://zhidao.baidu.com/question/985342871030671179.html


 5735
5735

 被折叠的 条评论
为什么被折叠?
被折叠的 条评论
为什么被折叠?
 到【灌水乐园】发言


