


—更新2024.股票的连接已经失效,本文仅提供一个思路-----
这年头,不会一点股票,简直就混的不行,但是股市也是很折磨人的,心态要控制好,心态不好的人,真的会炸,
在股市中,假设我们开始炒股了,采用了一种策略,那么这个策略是否是有效的呢?能不能赚钱,用历史数据来说话,可以赚钱,那么就长期坚持,不可以赚钱,那么就需要学习反思,这次,我要用excel来进行股票的历史数据回测,简单好用。
上代码:
使用的基本知识:
1‘股票的历史数据获取
2.用excel进行策略模拟
3.采用策略**计算收益
1‘股票的历史数据获取
采用的163的数据接口,访问就可以使用了,具体的code含义,网络上baidu一下,很多。
http://quotes.money.163.com/service/chddata.html?code=1000651&start=19991110&end=20220418&fields=TCLOSE;VOTURNOVER;TURNOVER;TCAP;MCAP
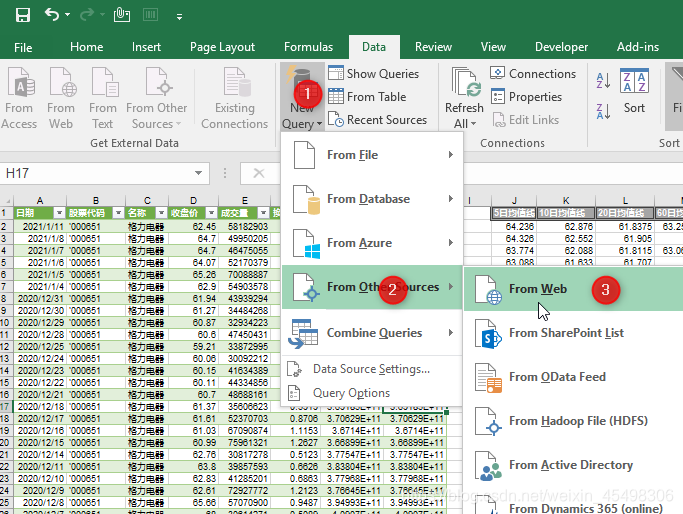
利用excel原本的数据query进行导入数据,就可以获取数据了,每天刷新一下就可以获取最新的数据了。
本文采用格力电器作为数据基础。
 奖数据进行处理,按照简单的算法进行计算:
2.用excel进行策略模拟
代码看文末的位置。
3.采用策略**计算收益
1.策略:金叉买入,死叉卖出
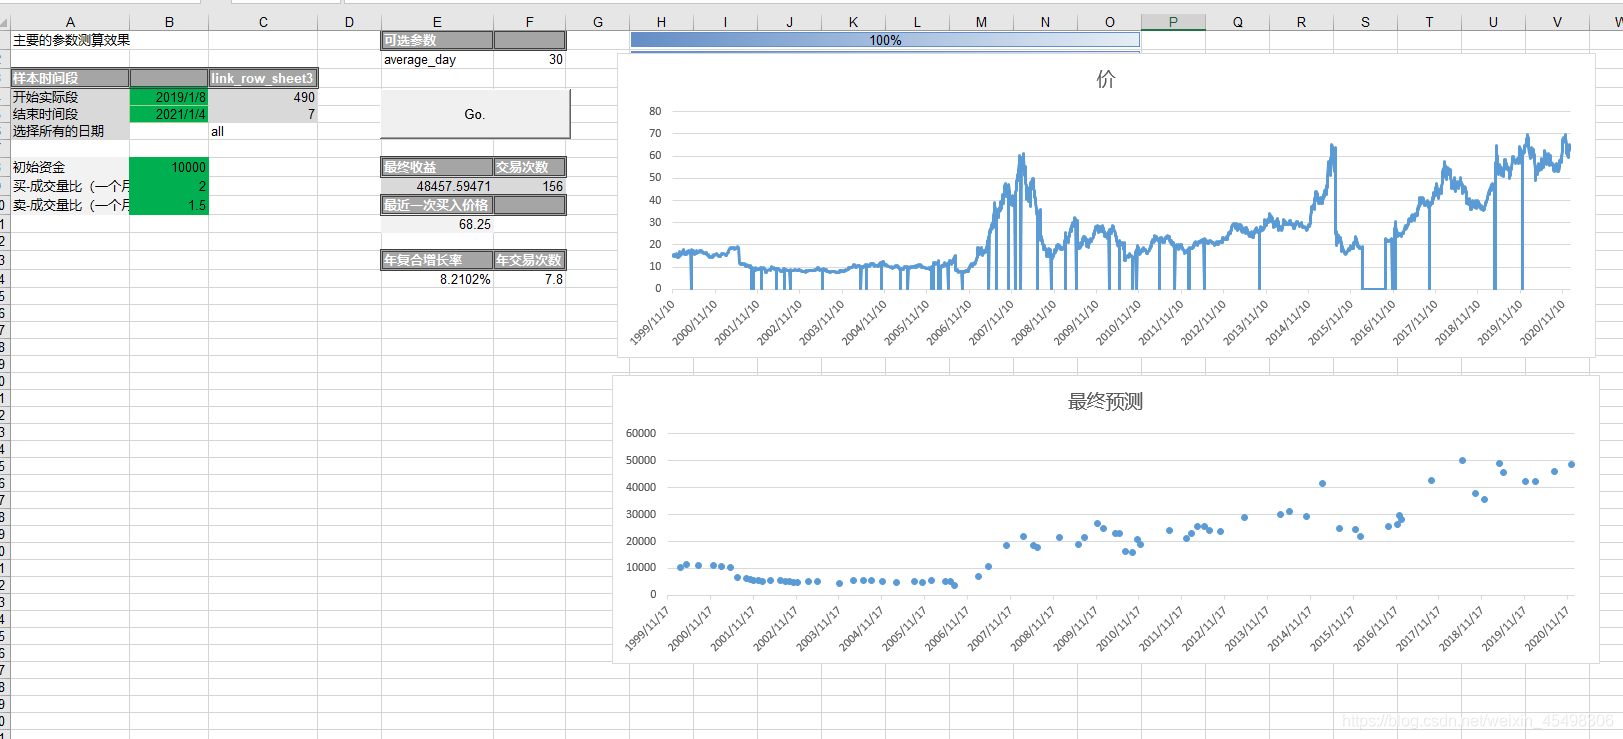
总结:
初始本金:10000
最终本金:48457.
总计20年,交易154次,15次/年
年受益为7.8%
查看中间过程,也有亏钱的,还是需要不断的改进策略,然后模拟实战,通过不不断的模拟,不断的补充理论知识和实战经验,这样才可以获取盈利的机会,
但是最起码,有个量化的指标,参考性会大一点,股价不可以预测,但是,我们可做多个准备。
Sub Run_stagty()
    On Error Resume Next
    Dim voluum As Boolean
    s_sale = 0
    s_buy = 0
'.........................................................................................
'2 condition . add >average 5
    With ThisWorkbook.Sheets("Sheet3")
        .Range("s2:S100000").Clear
        .Range("t2:t100000").Clear
        .Range("u2:u100000").Clear
        m_value = ThisWorkbook.Sheets("main").Range("B8").Value ' the initinal money
'.........................................................................................
'.........................................................................................
        If ThisWorkbook.Sheets("main").Range("C6").Value <> "all" Then
            count_l = ThisWorkbook.Sheets("main").Range("C4").Value
            star_date = ThisWorkbook.Sheets("main").Range("C5").Value
        Else
            star_date = 2
            count_l = .Range("l100000").End(xlUp).Row
        End If
        For i = count_l - 1 To star_date Step -1
            ThisWorkbook.Sheets("main").Range("H1") = (count_l - 1 - i) / (count_l - 1)
            If .Range("d" & i).Value <> 0 Then  ' remove the price=0
            'buy it
                If .Range("o" & i).Value > 0 Then
                    If s_buy = 0 Then
                        If .Range("p" & i + 1).Value < 0 And .Range("j" & i).Value > .Range("l" & i).Value Then
                            If d30_d(i) = True Then
                                .Range("s" & i).Value = "Buy"
                                c_q = .Range("T" & i).End(xlDown).Row
                                c_a = .Range("b100000").End(xlUp).Row
                                If c_q > c_a Then
                                    .Range("T" & i).Value = m_value / .Range("D" & i)
                               ' .Range("U" & i).Value = .Range("T" & i) * .Range("D" & i)
                                Else
                                    .Range("T" & i).Value = .Range("U" & c_q) / .Range("D" & i)
                               ' .Range("U" & i).Value = .Range("t" & i) * .Range("D" & i)
                                End If
                                s_buy = 1
                                s_sale = 0
                            End If
                        End If
                    End If
            'sell it
                Else
                    If s_sale = 0 And s_buy = 1 Then
                        If (.Range("p" & i + 1).Value) > 0 And (.Range("l" & i).Value) > (.Range("j" & i).Value) Then
                            If d30_d(i) = True Then
                                .Range("s" & i).Value = "Sale"
                                 c_q = .Range("T" & i).End(xlDown).Row
                                .Range("t" & i) = .Range("t" & c_q) * .Range("D" & i)
                                .Range("u" & i).Value = .Range("t" & i)
                                 s_buy = 0
                                 s_sale = 1
                            End If
                        End If
                    End If

                End If
            End If
        Next
'.....................................money& time ............................................
        m_f_value = .Range("U2").End(xlDown).Row ' the initinal money
        ThisWorkbook.Sheets("main").Range("E9").Value = .Range("U" & m_f_value) ' the final money
        ThisWorkbook.Sheets("main").Range("F9").Value = Application.WorksheetFunction.CountA(.Columns(19)) - 1 ' the final money
'.....................................last buy price ............................................
        col_s = .Range("s2").End(xlDown).Row
        If .Range("s" & col_s).Value = "Buy" Then
            ThisWorkbook.Sheets("main").Range("E11").Value = .Range("D" & col_s) ' the final money
        End If
   End With

End Sub


 2613
2613

 被折叠的 条评论
为什么被折叠?
被折叠的 条评论
为什么被折叠?
 到【灌水乐园】发言


