


matplotlib画柱状图📊 - plt.bar()、plt.barh()
一、plt.bar()、plt.barh()参数详解
简介:
plt.bar():正常柱状图📊📊,常见的统计图;
plt.barh():横向的柱状图,可以理解为正常柱状图旋转了90°。
import matplotlib as mpl
import matplotlib.pyplot as plt
from matplotlib.pyplot import MultipleLocator
from matplotlib import ticker
%matplotlib inline


plt.bar(x, height, width=0.8, bottom=None, *, align='center', data=None, **kwargs)

# 横向柱状图barh,简单理解bar旋转90°
plt.barh(y, width, height=0.8, left=None, *, align='center', **kwargs)
常用参数解释:
plt.bar()
x:表示x坐标,数据类型为int或float类型,刻度自适应调整;也可传dataframe的object,x轴上等间距排列;
height:表示柱状图的高度,也就是y坐标值,数据类型为int或float类型;
width:表示柱状图的宽度,取值在0~1之间,默认为0.8;
bottom:柱状图的起始位置,也就是y轴的起始坐标;
align:柱状图的中心位置,默认"center"居中,可设置为"lege"边缘;
color:柱状图颜色;
edgecolor:边框颜色;
linewidth:边框宽度;
tick_label:下标标签;
log:柱状图y周使用科学计算方法,bool类型;
orientation:柱状图是竖直还是水平,竖直:“vertical”,水平条:“horizontal”;
plt.barh()
y:表示y坐标,数据类型为int或float类型,刻度自适应调整;也可传dataframe的object,y轴上等间距排列;
height:表示柱状图的长度,也就是x坐标值,数据类型为int或float类型;
width:表示柱状图的高度,取值在0~1之间,默认为0.8;
其他参数与plt.bar()类似。
二、plt.bar()、plt.barh()简单应用
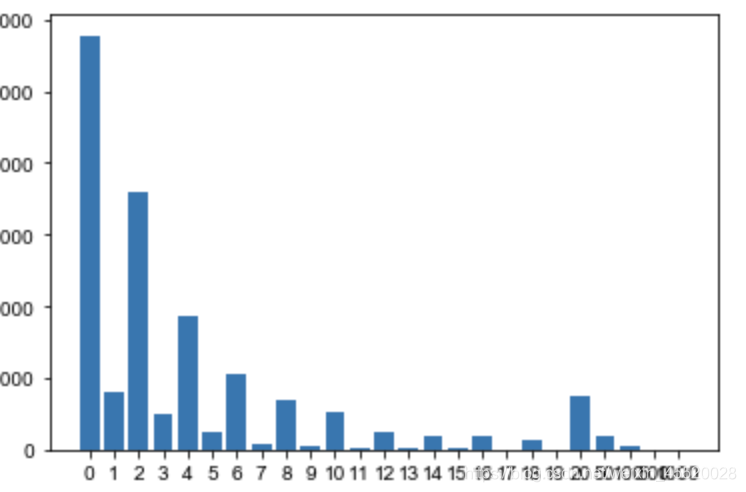
plt.bar()
import matplotlib.pyplot as plt
%matplotlib inline


# 最简单,只传递x和y
plt.bar(data3['sku_pri'],data3['lk_num'])
plt.show()
结果:
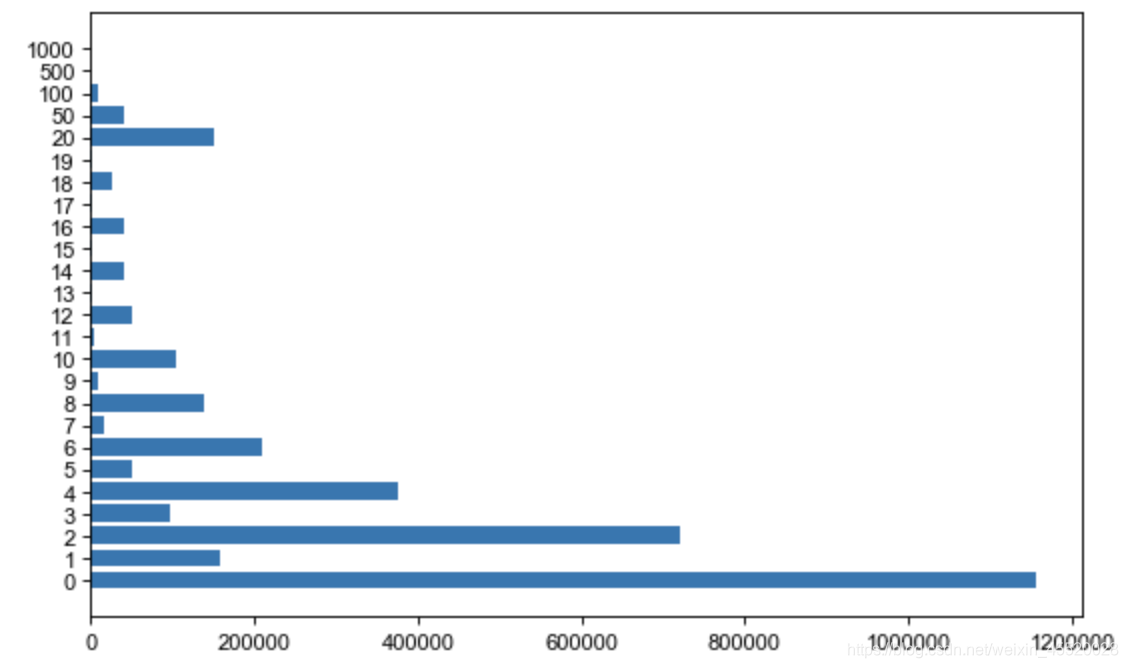
plt.barh()
import matplotlib.pyplot as plt
%matplotlib inline

# 横向柱状图barh()
# 最简单,只传递x和y
plt.barh(data3['sku_pri'],data3['lk_num'])
plt.show()
结果
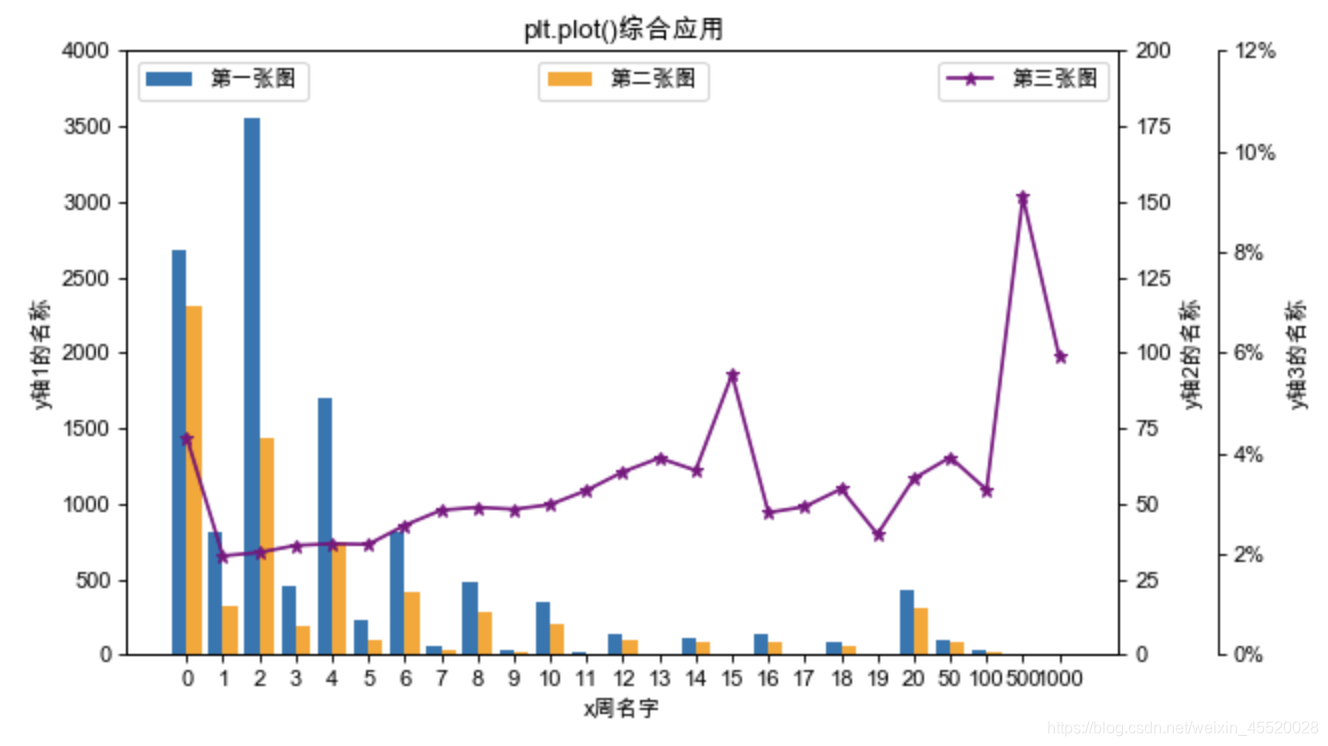
三、plt.bar()综合应用
import matplotlib as mpl
import matplotlib.pyplot as plt
from matplotlib.pyplot import MultipleLocator
from matplotlib import ticker
%matplotlib inline


# 第一个坐标轴和图
fig = plt.figure(figsize=(8,5), dpi=80)
ax = fig.add_subplot(1,1,1)
plt.subplot(1, 1, 1)

# 画多个图,传递多个不同的x轴刻度
x = [i for i in range(25)]  # x轴标准刻度
x1 = [i-0.2 for i in range(25)]  # 第一个图x轴左偏移0.2
x2 = [i+0.2 for i in range(25)]  # 第二个图x周右偏移0.2,防止重叠
xx = data3['sku_pri'].to_list()  # x周的刻度显示

ax.set_ylabel('y轴1的名称')
ax.set_xlabel('x周名字')
plt.bar(x1, data3['num_sales']/10000, width=0.4, label='第一张图')
plt.ylim(0,4000)
plt.xticks(x,xx)  # x周刻度显示
plt.title('plt.plot()综合应用')
ax.legend(loc='upper left')

# 第二个坐标轴和图
ax2 = ax.twinx()
ax2.spines['right'].set_position(('axes', 1.0))
ax2.set_ylabel('y轴2的名称')
plt.bar(x2, data3['lk_num']/10000, width=0.4, color='orange', label='第二张图')
plt.ylim(0,200)
plt.xticks(x,xx)
ax2.legend(loc='upper center')

# 第三个坐标和图
ax3 = ax.twinx()
ax3.spines['right'].set_position(('axes', 1.1))  # 1.1向右便宜避免重叠
ax3.set_ylabel('y轴3的名称')
plt.plot(x, data3['lk_ra'], marker='*',color='purple', label='第三张图')
plt.ylim(0,0.12)

# y轴3设置刻度未百分比
ax3.yaxis.set_major_locator(MultipleLocator(0.02))
ax3.yaxis.set_major_formatter(ticker.PercentFormatter(xmax=1, decimals=0))
plt.xticks(x,xx)

ax3.legend(loc='upper right')

# plt.savefig('保存图片名称'+'.png')
plt.show()
结果:
附:
官方参数解释:
plt.bar()
Parameters
----------
x : sequence of scalars
    The x coordinates of the bars. See also *align* for the
    alignment of the bars to the coordinates.
height : scalar or sequence of scalars
    The height(s) of the bars.
width : scalar or array-like, optional
    The width(s) of the bars (default: 0.8).
bottom : scalar or array-like, optional
    The y coordinate(s) of the bars bases (default: 0).
align : {'center', 'edge'}, optional, default: 'center'
    Alignment of the bars to the *x* coordinates:
    - 'center': Center the base on the *x* positions.
    - 'edge': Align the left edges of the bars with the *x* positions.
    To align the bars on the right edge pass a negative *width* and
    ``align='edge'``.

Returns
-------
container : `.BarContainer`
    Container with all the bars and optionally errorbars.


Other Parameters
----------------
color : scalar or array-like, optional
    The colors of the bar faces.
edgecolor : scalar or array-like, optional
    The colors of the bar edges.
linewidth : scalar or array-like, optional
    Width of the bar edge(s). If 0, don't draw edges.
tick_label : string or array-like, optional
    The tick labels of the bars.
    Default: None (Use default numeric labels.)
xerr, yerr : scalar or array-like of shape(N,) or shape(2,N), optional
    If not *None*, add horizontal / vertical errorbars to the bar tips.
    The values are +/- sizes relative to the data:
    - scalar: symmetric +/- values for all bars
    - shape(N,): symmetric +/- values for each bar
    - shape(2,N): Separate - and + values for each bar. First row
        contains the lower errors, the second row contains the
        upper errors.
    - *None*: No errorbar. (Default)
ecolor : scalar or array-like, optional, default: 'black'
    The line color of the errorbars.
capsize : scalar, optional
   The length of the error bar caps in points.
   Default: None, which will take the value from
   :rc:`errorbar.capsize`.
error_kw : dict, optional
    Dictionary of kwargs to be passed to the `~.Axes.errorbar`
    method. Values of *ecolor* or *capsize* defined here take
    precedence over the independent kwargs.
log : bool, optional, default: False
    If *True*, set the y-axis to be log scale.
orientation : {'vertical',  'horizontal'}, optional
    *This is for internal use only.* Please use `barh` for
    horizontal bar plots. Default: 'vertical'.

Other optional kwargs:
  agg_filter: a filter function, which takes a (m, n, 3) float array and a dpi value, and returns a (m, n, 3) array
  alpha: float or None
  animated: bool
  antialiased or aa: unknown
  capstyle: {'butt', 'round', 'projecting'}
  clip_box: `.Bbox`
  clip_on: bool
  clip_path: [(`~matplotlib.path.Path`, `.Transform`) | `.Patch` | None]
  color: color
  contains: callable
  edgecolor or ec: color or None or 'auto'
  facecolor or fc: color or None
  figure: `.Figure`
  fill: bool
  gid: str
  hatch: {'/', '\\', '|', '-', '+', 'x', 'o', 'O', '.', '*'}
  in_layout: bool
  joinstyle: {'miter', 'round', 'bevel'}
  label: object
  linestyle or ls: {'-', '--', '-.', ':', '', (offset, on-off-seq), ...}
  linewidth or lw: float or None
  path_effects: `.AbstractPathEffect`
  picker: None or bool or float or callable
  rasterized: bool or None
  sketch_params: (scale: float, length: float, randomness: float)
  snap: bool or None
  transform: `.Transform`
  url: str
  visible: bool
  zorder: float

.. note::
    In addition to the above described arguments, this function can take a
    **data** keyword argument. If such a **data** argument is given, the
    following arguments are replaced by **data[<arg>]**:

    * All positional and all keyword arguments.

    Objects passed as **data** must support item access (``data[<arg>]``) and
    membership test (``<arg> in data``).
plt,barh()
Parameters
----------
y : scalar or array-like
    The y coordinates of the bars. See also *align* for the
    alignment of the bars to the coordinates.

width : scalar or array-like
    The width(s) of the bars.

height : sequence of scalars, optional, default: 0.8
    The heights of the bars.

left : sequence of scalars
    The x coordinates of the left sides of the bars (default: 0).

align : {'center', 'edge'}, optional, default: 'center'
    Alignment of the base to the *y* coordinates*:

    - 'center': Center the bars on the *y* positions.
    - 'edge': Align the bottom edges of the bars with the *y*
      positions.

    To align the bars on the top edge pass a negative *height* and
    ``align='edge'``.


 1597
1597

 被折叠的 条评论
为什么被折叠?
被折叠的 条评论
为什么被折叠?
 到【灌水乐园】发言


