


import React, { useEffect, useRef } from 'react';
import { useSize, useDebounceEffect } from 'ahooks';
import LoopShowTooltip from './echartsTooltipLoop';
import * as echarts from 'echarts';

const CommonChart = props => {
    const { chartId, options, autoTooltip } = props;
    const chartRef = useRef();
    const size = useSize(chartRef);
    const loopRef = useRef();

    useEffect(() => {
        let chartDom;
        let myChart;
        if (loopRef.current) {
            loopRef.current?.clearLoop();
            loopRef.current = null;
        }
        setTimeout(() => {
            if (loopRef.current) {
                loopRef.current?.clearLoop();
                loopRef.current = null;
            }
            if (chartRef) {
                chartDom = chartRef.current;
                myChart = echarts.init(chartDom);
                options && myChart.setOption(options);
                if (autoTooltip) {
                    loopRef.current = new LoopShowTooltip(myChart, options, {});
                }
            }
        });
        window.onresize = () => {
            myChart.resize();
        };
        return () => {
            window.onresize = null;
            loopRef?.current?.clearLoop();
            loopRef.current = null;
        };
    }, [chartId, options]);

    useDebounceEffect(() => {
        let myChart;
        let chartDom;
        if (chartRef) {
            chartDom = chartRef.current;
            myChart = echarts.init(chartDom);
            options && myChart.setOption(options);
            myChart.resize();
        }
        window.onresize = () => {
            myChart.resize();
        };
    }, [size], {
        wait: 100,
    });

    return <div ref={chartRef} style={{ width: '100%', height: '100%' }}></div>;
};

export default CommonChart;
export default class LoopShowTooltip {
constructor(chart, chartOption, options) {
/**
* @param chart ECharts实例
* @param chartOption echarts的配置信息
* @param options object 选项
*/
this.chart = chart;
this.chartOption = chartOption;
this.options = options;
this.defaultOptions = {
interval: 2000,
loopSeries: false,
seriesIndex: 0,
updateData: null,
};
this.dataIndex = -1; // 数据索引,初始化为-1,是为了判断是否是第一次执行
this.seriesIndex = 0; // 系列索引
this.timeTicket = 0;
this.seriesLen = chartOption?.series?.length; // 系列个数
this.dataLen = 0; // 某个系列数据个数
// eslint-disable-next-line no-unused-expressions
this.chartType; // 系列类型
this.first = true;
this.lastShowSeriesIndex = 0;
this.lastShowDataIndex = 0;
this.zRender = chart?.getZr();
this.startLoop();
}
showTip(invalidSeries, invalidData) {
// 判断是否更新数据
if (this.dataIndex === 0 && !this.first && typeof this.options.updateData === 'function') {
this.options.updateData();
this.chart.setOption(this.chartOption);
}
let series = this.chartOption.series;
if (!series || !series.length) {
return;
}
let currSeries = series[this.seriesIndex];
if (!series || series.length === 0
|| !currSeries || !currSeries.type || !currSeries.data
|| !currSeries.data.length) {
return;
}
this.chartType = currSeries.type; // 系列类型
this.dataLen = currSeries.data.length; // 某个系列的数据个数
let tipParams = { seriesIndex: this.seriesIndex };
switch (this.chartType) {
case 'pie':
case 'map':
case 'chord':
tipParams.name = currSeries.data[this.dataIndex].name;
break;
case 'radar': // 雷达图
tipParams.seriesIndex = this.seriesIndex;
tipParams.dataIndex = this.dataIndex;
break;
default:
tipParams.dataIndex = this.dataIndex;
break;
}
if (this.chartType === 'pie' || this.chartType === 'radar') {
if (!this.first) {
this.cancelHighlight();
}
// 高亮当前图形
this.chart.dispatchAction({
type: 'highlight',
seriesIndex: this.seriesIndex,
dataIndex: this.dataIndex,
});
}
// 显示 tooltip
tipParams.type = 'showTip';
// 防止updateData时先处理tooltip后刷新数据导出tooltip显示不正确
setTimeout(() => {
this.chart.dispatchAction(tipParams);
}, 0);
this.lastShowSeriesIndex = this.seriesIndex;
this.lastShowDataIndex = this.dataIndex;
this.dataIndex = (this.dataIndex + 1) % this.dataLen;
if (this.options.loopSeries && this.dataIndex === 0) { // 数据索引归0表示当前系列数据已经循环完
invalidData = 0;
this.seriesIndex = (this.seriesIndex + 1) % this.seriesLen;
if (this.seriesIndex === this.options.seriesIndex) {
invalidSeries = 0;
}
}
this.first = false;
}
/**
* 自动轮播tooltip
*/
autoShowTip() {
this.showTip(0, 0);
this.timeTicket = setInterval(this.showTip.bind(this), this.options.interval);
}
startLoop() {
if (!this.chart || !this.chartOption) {
return;
}
if (this.seriesLen === 0) {
return;
}
if (this.options) {
this.options.interval = this.options.interval || this.defaultOptions.interval;
this.options.loopSeries = this.options.loopSeries || this.defaultOptions.loopSeries;
this.options.seriesIndex = this.options.seriesIndex || this.defaultOptions.seriesIndex;
this.options.updateData = this.options.updateData || this.defaultOptions.updateData;
} else {
this.options = this.defaultOptions;
}
// 如果设置的seriesIndex无效,则默认为0
if (this.options.seriesIndex < 0 || this.options.seriesIndex >= this.seriesLen) {
this.seriesIndex = 0;
} else {
this.seriesIndex = this.options.seriesIndex;
}
// 鼠标在echarts图上时停止轮播
this.chart.on('mousemove', this.stopAutoShow.bind(this));
this.zRender.on('mousemove', this.zRenderMouseMove.bind(this));
this.zRender.on('globalout', this.zRenderGlobalOut.bind(this));
this.autoShowTip();
}
/**
* 取消高亮
*/
cancelHighlight() {
/**
* 如果dataIndex为0表示上次系列完成显示,如果是循环系列,且系列索引为0则上次是seriesLen-1,否则为seriesIndex-1;
* 如果不是循环系列,则就是当前系列;
* 如果dataIndex>0则就是当前系列。
*/
let tempSeriesIndex = this.dataIndex === 0
? (this.options.loopSeries
? (this.seriesIndex === 0 ? this.seriesLen - 1 : this.seriesIndex - 1)
: this.seriesIndex)
: this.seriesIndex;
let tempType = this.chartOption.series[tempSeriesIndex].type;
if (tempType === 'pie' || tempType === 'radar') {
this.chart.dispatchAction({
type: 'downplay',
seriesIndex: this.lastShowSeriesIndex,
dataIndex: this.lastShowDataIndex,
});// wait 系列序号为0且循环系列,则要判断上次的系列类型是否是pie、radar
}
}
zRenderMouseMove(param) {
if (param.event) {
// 阻止canvas上的鼠标移动事件冒泡
param.event.cancelBubble = true;
}
this.stopAutoShow();
}
// 离开echarts图时恢复自动轮播
zRenderGlobalOut() {
if (!this.timeTicket) {
this.autoShowTip();
}
}
// 关闭轮播
stopAutoShow() {
if (this.timeTicket) {
clearInterval(this.timeTicket);
this.timeTicket = 0;
if (this.chartType === 'pie' || this.chartType === 'radar') {
this.cancelHighlight();
}
}
}
clearLoop() {
this.stopAutoShow();
this.chart.off('mousemove', this.stopAutoShow);
this.zRender.off('mousemove', this.zRenderMouseMove);
this.zRender.off('globalout', this.zRenderGlobalOut);
};
}使用案例
import React from "react";
import CommonChart from './pages/CommonChart/UI'
const Demo = () => {
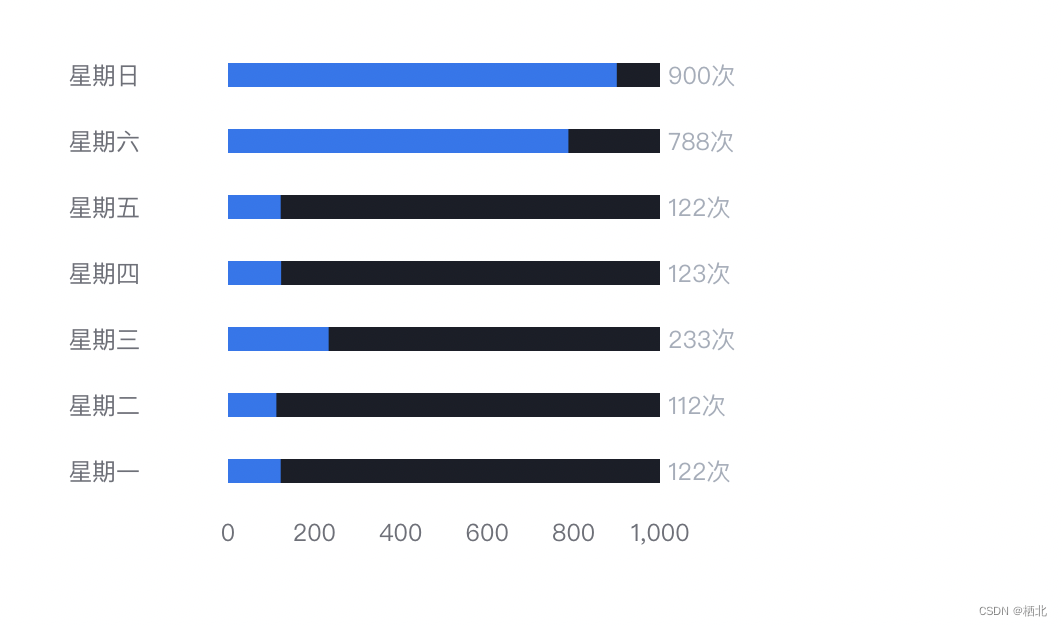
let echarData = [122,112,233,123,122,788,900];
let yAxisData = ['星期一','星期二','星期三','星期四','星期五','星期六','星期日'];
const chartOptions = {
grid: {
top: '8%',
bottom: '15%',
left: '30%',
right: '16%',
// containLabel: true,
},
tooltip: {
trigger: 'item',
show: true,
backgroundColor: '#3A3F4D',
borderWidth: 0,
textStyle: {
// 提示框浮层的文本样式。
color: '#B1B6C2',
fontStyle: 'normal',
fontWeight: 'normal',
fontFamily: 'sans-serif',
fontSize: 14,
},
formatter: record => {
let result = `${record.name}:${record.value} 次`;
return result;
},
},
xAxis: {
type: 'value',
boundaryGap: [0, 0.01],
splitLine: {
show: false,
},
},
yAxis: {
type: 'category',
data: yAxisData,
scale: true,
axisTick: {
// x轴刻度线
show: false,
alignWithLabel: true,
},
axisLabel: {
interval: 0,
width: 80,
overflow: 'truncate',
ellipsis: '...',
align: 'left',
margin: 80,
},
axisLine: {
// 坐标轴
show: false,
},
},
series: [
{
name: '2011',
type: 'bar',
showBackground: true,
backgroundStyle: {
color: '#1A1E28',
},
barWidth: 12, // 柱图宽度
itemStyle: {
normal: {
// 柱状图上显示数量
label: {
show: true, // 是否显示
position: [220, 0], // 位置
formatter: '{@value}' + '次', // 内容
color: '#A5ADBA', // 文字颜色
},
color: '#2275F0', // 柱子颜色
},
},
data: echarData,
},
],
};
return (
<div style={{height:300, width: 400}}>
<CommonChart options={chartOptions} />
</div>
);
};
export default Demo;


 324
324


 被折叠的 条评论
为什么被折叠?
被折叠的 条评论
为什么被折叠?
 到【灌水乐园】发言


