


前言
为了应付作业,想上网找一个代码交了,发现没有自己想要的东西,于是自己含泪写了两天 为了认真学习,跟同学们卷起来🤣
要是你就需要交作业,直接看源码就好了,在CleaningData()方法里,你必须得改成你需要的数据,其他的我都帮你写好了
目标
对数据中的缺失值和异常值进行处理(找出来和重新赋值)
过程
空白值(缺失值)
空白值的处理,我使用的方法是空白值的前后两行的平均值来赋值;
如果前后两行都是空白值,那就一直找到有位置;
如果一列只有一个数据,我就用这个数据来给整列赋值ψ(`∇´)ψ
(至少我希望不要出现最后一种情况)
异常值
异常值的处理,我使用的是三点拉格朗日插值法
为什么要用这个呢?因为老师要求ƪ(˘⌣˘)ʃ
利用三个点来求出一条未知的方程式,通过这个方程式来预测异常值位置的值。
这个方程式是可以求出来的,你可以试着输出。(下面演示给你看)
收获
收获一:
# 显示所有列
pd.set_option('display.max_columns', None)
# 显示所有行
pd.set_option('display.max_rows', None)
# 对齐列名
pd.set_option('display.unicode.ambiguous_as_wide', True)
pd.set_option('display.unicode.east_asian_width', True)
# 取消科学计数法输出
np.set_printoptions(suppress=True)
# 为了直观的显示数字,不采用科学计数法
pd.set_option('display.float_format', lambda x: '%.2f' % x)
# 用来正常显示中文标签
plt.rcParams['font.sans-serif'] = ['SimHei']
# 用来正常显示负号
plt.rcParams['axes.unicode_minus'] = False
收获二:
np.where(data == ‘1’):找出1的位置
print(np.where(data == '')) # 找出空白值的坐标
收获三:
有效的多维迭代器对象,可以遍历数组。
这里我是将字符串的数据转换成浮点数,两个可以实现
np.nditer(row)
或
[float(num) for num in arr[:, 0]]
收获四:
三点拉格朗日插值法
from scipy.interpolate import lagrange
iloc_point_of_time = [float(num) for num in arr[:, 0]][4:7:1]
iloc_temperature = [float(num) for num in arr[:, 1]][4:7:1]
a1 = lagrange(iloc_point_of_time, iloc_temperature)
print(a1)
收获五:
想要做出折线图上的点能突出显示,只需要plot()和scatter()同时使用就好了
就是折线图和散点图结合起来

核心源码
处理空白值
得到空白数组的坐标数组,将数组的元素传递给Fill_Value(arr, row, col)中的row和col
def Create_Fill_Value_Arr(arr):  # 需要的是坐标,那么横坐标和纵坐标的数量应该相同,创建一个len(row)长度的2维零数组
    # row和col分别是横坐标和纵坐标的集合
    # print(np.where(data == ''))  # 找出空白值的坐标
    row = np.where(arr == '')[0]
    col = np.where(arr == '')[1]
    CoordinateArray = np.zeros((len(row), 2))  # 空白值坐标数组
    row_count = 0
    for i in np.nditer(row):
        CoordinateArray[row_count][0] = i
        row_count += 1
    col_count = 0
    for i in np.nditer(col):
        CoordinateArray[col_count][1] = i
        col_count += 1
    return CoordinateArray
arr:需要处理的数组
row:需要处理的元素横坐标
col:需要处理的元素的纵坐标
def Fill_Value(arr, row, col):
    # 二维数组填充空白值
    # 这里有个前提条件,这个是根据同一列的上下行的值来进行赋值,所以列必须不能1变化,仅对行数进行变化
    current_row = row  # 记录输入时的行数
    current_col = col  # 记录输入时的列数
    next_row = 0  # 记录下一行的行数
    next_col = col  # 记录下一列的列数
    pre_row = 0  # 记录上一行的行数
    pre_col = col  # 记录上一列的列数

    # 第一行和最后一行的赋值
    if row == 0 or row == len(arr) - 1:
        if row == 0:  # 如果输入的元素位置在第一行,则将同列下一行的非空数赋值给它
            flag = True  # 标签,如果赋值结束,则结束循环
            while flag:
                current_row += 1
                if arr[current_row][current_col] != '':
                    arr[row][col] = arr[current_row][current_col]  # 赋值
                    flag = False
                elif arr[current_row][current_col] == '':  # 判断,如果当前的这个数为空值
                    current_row += 1  # 则寻找同列下一行的值
                else:
                    print("Fill_Value()方法==第一行==出错啦!!")
        elif row == len(arr) - 1:  # 如果输入的元素位置在最后一行,则将同列上一行的非空数赋值给它
            flag = True  # 标签,如果赋值结束,则结束循环
            current_row -= 1
            while flag:
                if arr[current_row][current_col] != '':
                    arr[row][col] = arr[current_row][current_col]
                    flag = False
                elif arr[current_row][current_col] == '':
                    current_row -= 1
                else:
                    print("Fill_Value()方法的==最后一行==出错啦!!")
        else:
            print("如果出现这个,则是第一行和最后一行的条件判断错误")

    # 非第一行和最后一行的赋值
    elif row != 0 and row != len(arr) - 1:  # 把该值的同列的上下两行的平均值赋值给它
        # 这里有一个算数的坑,就是到这一行时,前面的数一定都是非空的值,因为上面的算法将前面的值都填充了,
        # 所以对于这个数来说,前n行都是有值,但是后面的是不一定有值的,有可能很多行都是空值,
        # 因此需要我们在选取下一个值的时候稍加判断
        # 这里的做法是将后面无论隔了多少行,一定要找到一个值来做平均处理
        # 要是在这一行的所有行全是空白值,那么这里的算法则将这一行的上一个值赋值给后面的所有行
        flag = True  # 标签,如果赋值结束,则结束循环
        next_row = current_row + 1
        pre_row = current_row - 1
        while flag:
            if arr[next_row][next_col] != '':  # 这里判断下一行是不是空值
                arr[row][col] = str((float(arr[next_row][next_col]) +  # 这里因为涉及到两个数的数值计算,所以需要转化为数值类型,而上面的仅涉及到单行的赋值行为
                                     float(arr[pre_row][pre_col])) / 2)  # 这里需要用浮点数,不能用整数
                flag = False
            elif arr[next_row][next_col] == '':
                next_row += 1
            else:
                print("Fill_Value()方法的==非第一行和最后一行的赋值==出错啦!!")
    else:
        print('这怎么会错了?')
    return arr
处理异常值
这里需要你自己修改一些数据,因为写得时候发现要是精益求精的话一个星期都不够我写,所以我只能偷偷懒了,见谅见谅(´▽ʃ♡ƪ)(≧∇≦)ノ(❁´◡❁)
arr:输入处理完空白值后的数组
# 通过箱型图得出不正常的数据
def CleaningData(arr):
    # arr的数据全是字符串
    # 如果一个数据跟表中所有数据相比是相差非常大的,那么就有必要进行数值替换,将正常的数据替换异常的数据
    point_of_time = [float(num) for num in arr[:, 0]]  # 这个采集样本时间点应该用不到
    temperature = [float(num) for num in arr[:, 1]]
    relative_humidity = [float(num) for num in arr[:, 2]]
    Gas_concentration = [float(num) for num in arr[:, 3]]
    Carbon_monoxide_concentration = [float(num) for num in arr[:, 4]]
    # data的数据全是float
    data = {
        'temperature': temperature,
        'relative_humidity': relative_humidity,
        'Gas_concentration': Gas_concentration,
        'Carbon_monoxide_concentration': Carbon_monoxide_concentration,
    }
    df = pd.DataFrame(data)
    df.boxplot()  # 这里,pandas自己有处理的过程
    plt.ylabel("ylabel")
    plt.xlabel("xlabel")  # 我们设置横纵坐标的标题。
    plt.savefig('箱型图.jpg')
    plt.show()
    # 这里的des数据来自df.describe(),因为
    des = {
        'temperature': {
            'count': 44.00,
            'mean': 53.63,
            'std': 146.07,
            'min': 20.50,
            '25%': 29.06,
            '50%': 31.73,
            '75%': 35.93,
            'max': 999.99,
        },
        'relative_humidity': {
            'count': 44.00,
            'mean': 118.39,
            'std': 194.72,
            'min': 60.00,
            '25%': 67.00,
            '50%': 76.00,
            '75%': 88.25,
            'max': 999.99,
        },
        'Gas_concentration': {
            'count': 44.00,
            'mean': 25.23,
            'std': 150.37,
            'min': 1.08,
            '25%': 1.90,
            '50%': 2.65,
            '75%': 3.39,
            'max': 999.99,
        },
        'Carbon_monoxide_concentration': {
            'count': 44.00,
            'mean': 49.15,
            'std': 209.90,
            'min': 1.08,
            '25%': 2.47,
            '50%': 3.94,
            '75%': 5.23,
            'max': 999.99,
        }
    }
    columns_list = ['temperature', 'relative_humidity', 'Gas_concentration', 'Carbon_monoxide_concentration']
    # 如果有值超过平均值,该值则视为异常值
    arrays_list = []  # 这个列表来记录异常值的坐标
    col = 0
    row = 0
    for col_list in columns_list:
        for i in range(len(arr)):
            if data[col_list][row] >= des[col_list]['std']:
                arrays_list.append([row, col])
                row += 1
            elif data[col_list][row] < des[col_list]['std']:
                row += 1
            else:
                print("这个一次都不能出现")
        col += 1
        row = 0
    # 三个值选择(4,5,6)行
    iloc_point_of_time = [float(num) for num in arr[:, 0]][4:7:1]  # 这个采集样本时间
    iloc_temperature = [float(num) for num in arr[:, 1]][4:7:1]
    iloc_relative_humidity = [float(num) for num in arr[:, 2]][4:7:1]
    iloc_Gas_concentration = [float(num) for num in arr[:, 3]][4:7:1]
    iloc_Carbon_monoxide_concentration = [float(num) for num in arr[:, 4]][4:7:1]
    # 这里使用拉格朗日三值插点法,调用lagrange()函数
    a1 = lagrange(iloc_point_of_time, iloc_temperature)
    a2 = lagrange(iloc_point_of_time, iloc_relative_humidity)
    a3 = lagrange(iloc_point_of_time, iloc_Gas_concentration)
    a4 = lagrange(iloc_point_of_time, iloc_Carbon_monoxide_concentration)
    # 将异常值进行赋值
    for i in range(len(arrays_list)):
        if arrays_list[i][1] == 0:
            arr[arrays_list[i][0]][1] = a1(arrays_list[i][1])
        elif arrays_list[i][1] == 1:
            arr[arrays_list[i][0]][2] = a2(arrays_list[i][1])
        elif arrays_list[i][1] == 2:
            arr[arrays_list[i][0]][3] = a3(arrays_list[i][1])
        elif arrays_list[i][1] == 3:
            arr[arrays_list[i][0]][4] = a4(arrays_list[i][1])
    print(arr)
    return arr
写在最后
因为写的代码质量不高,所以你要看完整篇博客的话会很头疼。
你要是很需要进行数据处理代码的话,我尽量提取我觉得的是重点的内容。
希望这篇博客可以帮到你,解决你的问题。
等再深入一点再来修改这个源码。
源文件
数据
我觉得你应该可以把这些数据录入csv文件中,反正能读取到就好了
 (~ ̄▽ ̄)~
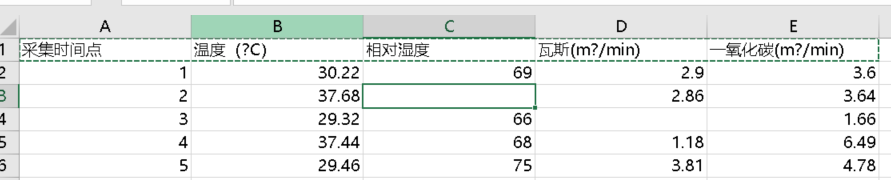
1,30.22,69,2.9,3.6
2,37.68,,2.86,3.64
3,29.32,66,,1.66
4,37.44,68,1.18,6.49
5,29.46,75,3.81,4.78
6,30.12,77,1.93,4.2
7,26.3,83,2.07,3.67
8,,66,1.46,
9,34.38,62,3.36,4.39
10,30.79,75,2.4,5.79
11,25.17,69,3.34,6.28
12,20.5,80,2.95,6.22
13,37.21,,999.99,4.75
14,31.88,94,2.41,1.49
15,39.94,77,1.98,1.08
16,33.65,67,2.03,
17,27.21,79,1.41,2.5
18,27.57,999,3.39,1.7
19,31.59,94,3.27,5.02
20,,93,,4.69
21,34.88,92,1.58,3.01
22,29.65,92,2.69,5.16
23,26.05,80,2.61,2.8
24,33.5,79,1.26,6.81
25,34.71,72,1.82,2.49
26,999.99,,3.77,999.99
27,37.06,99,1.94,3.85
28,28.57,64,3.93,
29,28,66,1.08,2.4
30,25.67,60,2.33,3.84
31,20.59,67,3.88,5.19
32,39.84,999,3.4,3.77
33,29.22,74,1.09,999.99
34,33.19,61,3.22,1.74
35,38.7,62,3.61,6.52
36,,62,,6.83
37,21.56,93,3.63,4.43
38,38.06,67,3.21,2.41
39,37.95,68,1.12,4.56
40,35.8,96,1.52,5.54
41,29.75,80,1.3,2.23
42,32.69,69,3.26,1.43
43,33.94,96,3.42,1.4
44,36.31,78,3.69,5.34
源码
import pandas as pd
import numpy as np
import matplotlib.pyplot as plt
from scipy.interpolate import lagrange

# 显示所有列
pd.set_option('display.max_columns', None)
# 显示所有行
pd.set_option('display.max_rows', None)
# 对齐列名
pd.set_option('display.unicode.ambiguous_as_wide', True)
pd.set_option('display.unicode.east_asian_width', True)
# 取消科学计数法输出
np.set_printoptions(suppress=True)
# 为了直观的显示数字,不采用科学计数法
pd.set_option('display.float_format', lambda x: '%.2f' % x)

'''
    param :
        arr: 目标数组
        row:行
        col:列
'''
def Fill_Value(arr, row, col):
    # 二维数组填充空白值
    # 这里有个前提条件,这个是根据同一列的上下行的值来进行赋值,所以列必须不能1变化,仅对行数进行变化
    current_row = row  # 记录输入时的行数
    current_col = col  # 记录输入时的列数
    next_row = 0  # 记录下一行的行数
    next_col = col  # 记录下一列的列数
    pre_row = 0  # 记录上一行的行数
    pre_col = col  # 记录上一列的列数

    # 第一行和最后一行的赋值
    if row == 0 or row == len(arr) - 1:
        if row == 0:  # 如果输入的元素位置在第一行,则将同列下一行的非空数赋值给它
            flag = True  # 标签,如果赋值结束,则结束循环
            while flag:
                current_row += 1
                if arr[current_row][current_col] != '':
                    arr[row][col] = arr[current_row][current_col]  # 赋值
                    flag = False
                elif arr[current_row][current_col] == '':  # 判断,如果当前的这个数为空值
                    current_row += 1  # 则寻找同列下一行的值
                else:
                    print("Fill_Value()方法==第一行==出错啦!!")
        elif row == len(arr) - 1:  # 如果输入的元素位置在最后一行,则将同列上一行的非空数赋值给它
            flag = True  # 标签,如果赋值结束,则结束循环
            current_row -= 1
            while flag:
                if arr[current_row][current_col] != '':
                    arr[row][col] = arr[current_row][current_col]
                    flag = False
                elif arr[current_row][current_col] == '':
                    current_row -= 1
                else:
                    print("Fill_Value()方法的==最后一行==出错啦!!")
        else:
            print("如果出现这个,则是第一行和最后一行的条件判断错误")

    # 非第一行和最后一行的赋值
    elif row != 0 and row != len(arr) - 1:  # 把该值的同列的上下两行的平均值赋值给它
        # 这里有一个算数的坑,就是到这一行时,前面的数一定都是非空的值,因为上面的算法将前面的值都填充了,
        # 所以对于这个数来说,前n行都是有值,但是后面的是不一定有值的,有可能很多行都是空值,
        # 因此需要我们在选取下一个值的时候稍加判断
        # 这里的做法是将后面无论隔了多少行,一定要找到一个值来做平均处理
        # 要是在这一行的所有行全是空白值,那么这里的算法则将这一行的上一个值赋值给后面的所有行
        flag = True  # 标签,如果赋值结束,则结束循环
        next_row = current_row + 1
        pre_row = current_row - 1
        while flag:
            if arr[next_row][next_col] != '':  # 这里判断下一行是不是空值
                arr[row][col] = str((float(arr[next_row][next_col]) +  # 这里因为涉及到两个数的数值计算,所以需要转化为数值类型,而上面的仅涉及到单行的赋值行为
                                     float(arr[pre_row][pre_col])) / 2)  # 这里需要用浮点数,不能用整数
                flag = False
            elif arr[next_row][next_col] == '':
                next_row += 1
            else:
                print("Fill_Value()方法的==非第一行和最后一行的赋值==出错啦!!")
    else:
        print('这怎么会错了?')
    return arr


def Create_Fill_Value_Arr(arr):  # 需要的是坐标,那么横坐标和纵坐标的数量应该相同,创建一个len(row)长度的2维零数组
    # row和col分别是横坐标和纵坐标的集合
    # print(np.where(data == ''))  # 找出空白值的坐标
    row = np.where(arr == '')[0]
    col = np.where(arr == '')[1]
    CoordinateArray = np.zeros((len(row), 2))  # 空白值坐标数组
    row_count = 0
    for i in np.nditer(row):
        CoordinateArray[row_count][0] = i
        row_count += 1
    col_count = 0
    for i in np.nditer(col):
        CoordinateArray[col_count][1] = i
        col_count += 1
    return CoordinateArray


# 通过箱型图得出不正常的数据
def CleaningData(arr):
    # arr的数据全是字符串
    # 如果一个数据跟表中所有数据相比是相差非常大的,那么就有必要进行数值替换,将正常的数据替换异常的数据
    point_of_time = [float(num) for num in arr[:, 0]]  # 这个采集样本时间点应该用不到
    temperature = [float(num) for num in arr[:, 1]]
    relative_humidity = [float(num) for num in arr[:, 2]]
    Gas_concentration = [float(num) for num in arr[:, 3]]
    Carbon_monoxide_concentration = [float(num) for num in arr[:, 4]]
    # data的数据全是float
    data = {
        'temperature': temperature,
        'relative_humidity': relative_humidity,
        'Gas_concentration': Gas_concentration,
        'Carbon_monoxide_concentration': Carbon_monoxide_concentration,
    }
    df = pd.DataFrame(data)
    df.boxplot()  # 这里,pandas自己有处理的过程
    plt.ylabel("ylabel")
    plt.xlabel("xlabel")  # 我们设置横纵坐标的标题。
    plt.savefig('箱型图.jpg')
    plt.show()
    # 这里的des数据来自df.describe(),因为
    des = {
        'temperature': {
            'count': 44.00,
            'mean': 53.63,
            'std': 146.07,
            'min': 20.50,
            '25%': 29.06,
            '50%': 31.73,
            '75%': 35.93,
            'max': 999.99,
        },
        'relative_humidity': {
            'count': 44.00,
            'mean': 118.39,
            'std': 194.72,
            'min': 60.00,
            '25%': 67.00,
            '50%': 76.00,
            '75%': 88.25,
            'max': 999.99,
        },
        'Gas_concentration': {
            'count': 44.00,
            'mean': 25.23,
            'std': 150.37,
            'min': 1.08,
            '25%': 1.90,
            '50%': 2.65,
            '75%': 3.39,
            'max': 999.99,
        },
        'Carbon_monoxide_concentration': {
            'count': 44.00,
            'mean': 49.15,
            'std': 209.90,
            'min': 1.08,
            '25%': 2.47,
            '50%': 3.94,
            '75%': 5.23,
            'max': 999.99,
        }
    }
    columns_list = ['temperature', 'relative_humidity', 'Gas_concentration', 'Carbon_monoxide_concentration']
    # 如果有值超过平均值,该值则视为异常值
    arrays_list = []  # 这个列表来记录异常值的坐标
    col = 0
    row = 0
    for col_list in columns_list:
        for i in range(len(arr)):
            if data[col_list][row] >= des[col_list]['std']:
                arrays_list.append([row, col])
                row += 1
            elif data[col_list][row] < des[col_list]['std']:
                row += 1
            else:
                print("这个一次都不能出现")
        col += 1
        row = 0
    # 三个值选择(4,5,6)行
    iloc_point_of_time = [float(num) for num in arr[:, 0]][4:7:1]  # 这个采集样本时间
    iloc_temperature = [float(num) for num in arr[:, 1]][4:7:1]
    iloc_relative_humidity = [float(num) for num in arr[:, 2]][4:7:1]
    iloc_Gas_concentration = [float(num) for num in arr[:, 3]][4:7:1]
    iloc_Carbon_monoxide_concentration = [float(num) for num in arr[:, 4]][4:7:1]
    # 这里使用拉格朗日三值插点法,调用lagrange()函数
    a1 = lagrange(iloc_point_of_time, iloc_temperature)
    a2 = lagrange(iloc_point_of_time, iloc_relative_humidity)
    a3 = lagrange(iloc_point_of_time, iloc_Gas_concentration)
    a4 = lagrange(iloc_point_of_time, iloc_Carbon_monoxide_concentration)
    # 将异常值进行赋值
    for i in range(len(arrays_list)):
        if arrays_list[i][1] == 0:
            arr[arrays_list[i][0]][1] = a1(arrays_list[i][1])
        elif arrays_list[i][1] == 1:
            arr[arrays_list[i][0]][2] = a2(arrays_list[i][1])
        elif arrays_list[i][1] == 2:
            arr[arrays_list[i][0]][3] = a3(arrays_list[i][1])
        elif arrays_list[i][1] == 3:
            arr[arrays_list[i][0]][4] = a4(arrays_list[i][1])
    # print(arr)
    return arr


# 将数据用图像的形式表现
def CreatePicture(arr):
    # 这里针对文件创造了相对应的变量,对其他文件可能不适用
    # 因为一开始的值为字符串,所以需要将列表里的字符串转化为浮点型,不然会报错
    point_of_time = [float(num) for num in arr[:, 0]]
    temperature = [float(num) for num in arr[:, 1]]
    relative_humidity = [float(num) for num in arr[:, 2]]
    Gas_concentration = [float(num) for num in arr[:, 3]]
    Carbon_monoxide_concentration = [float(num) for num in arr[:, 4]]
    # 把每个点都连成线段
    plt.plot(point_of_time, temperature, label="温度(℃)", linestyle=":")
    plt.plot(point_of_time, relative_humidity, label="相对湿度", linestyle="--")
    plt.plot(point_of_time, Gas_concentration, label="瓦斯浓度", linestyle="-.")
    plt.plot(point_of_time, Carbon_monoxide_concentration,
             label="一氧化碳浓度", linestyle="-")
    # 将每个点都表示出来
    plt.scatter(point_of_time, temperature, s=10)
    plt.scatter(point_of_time, relative_humidity, s=10)
    plt.scatter(point_of_time, Gas_concentration, s=10)
    plt.scatter(point_of_time, Carbon_monoxide_concentration, s=10)
    plt.rcParams['font.sans-serif'] = ['SimHei']  # 用来正常显示中文标签
    plt.rcParams['axes.unicode_minus'] = False  # 用来正常显示负号
    plt.title("煤矿采样数据表", fontsize=18)
    plt.xlabel("采样时间点", fontsize=12)
    plt.ylabel("数值", fontsize=12)
    plt.legend(fontsize=10)
    plt.savefig('折线图.jpg')
    plt.show()


# 将所有需要的函数封装在main()方法里
def main(file):
    # 这里的类型转换为字符串类型,因为空值和数值用float或int都不太合适
    data = np.loadtxt(file, skiprows=1, dtype=str, delimiter=',')
    CoordinateArray = Create_Fill_Value_Arr(data)  # 返回一个包含所有空值的坐标数组
    for i in range(len(CoordinateArray)):
        arr_final = Fill_Value(
            data, int(CoordinateArray[i][0]), int(CoordinateArray[i][1]))  # 这里虽然是浮点型转换为整数型,但是这里的坐标都应该是整数,所以这个强制转换没有问题
    arr_finally = CleaningData(arr_final)
    CreatePicture(arr_finally)
    return arr_finally


# 这里最好使用绝对地址,因为有些软件对相对地址的定位好像是不大准确的
file = r'作业\第八周\ug_detect.csv'
print(main(file))
运行结果
这是修改后的结果,之前的异常值和空白值都被重新赋值了
有个小问题是:温度有一个计算后的异常值,可能是提醒我不要掉以轻心,自我感觉超好的代码也会有异常
[['1' '30.22' '69' '2.9' '3.6']
 ['2' '37.68' '67.5' '2.86' '3.64']
 ['3' '29.32' '66' '2.02' '1.66']
 ['4' '37.44' '68' '1.18' '6.49']
 ['5' '29.46' '75' '3.81' '4.78']
 ['6' '30.12' '77' '1.93' '4.2']
 ['7' '26.3' '83' '2.07' '3.67']
 ['8' '30.340' '66' '1.46' '4.0299']
 ['9' '34.38' '62' '3.36' '4.39']
 ['10' '30.79' '75' '2.4' '5.79']
 ['11' '25.17' '69' '3.34' '6.28']
 ['12' '20.5' '80' '2.95' '6.22']
 ['13' '37.21' '87.0' '21.569' '4.75']
 ['14' '31.88' '94' '2.41' '1.49']
 ['15' '39.94' '77' '1.98' '1.08']
 ['16' '33.65' '67' '2.03' '1.79']
 ['17' '27.21' '79' '1.41' '2.5']
 ['18' '27.57' '107.0' '3.39' '1.7']
 ['19' '31.59' '94' '3.27' '5.02']
 ['20' '33.235' '93' '2.425' '4.69']
 ['21' '34.88' '92' '1.58' '3.01']
 ['22' '29.65' '92' '2.69' '5.16']
 ['23' '26.05' '80' '2.61' '2.8']
 ['24' '33.5' '79' '1.26' '6.81']
 ['25' '34.71' '72' '1.82' '2.49']
 ['26' '-41.04' '85.5' '3.77' '6.0900']
 ['27' '37.06' '99' '1.94' '3.85']
 ['28' '28.57' '64' '3.93' '3.125']
 ['29' '28' '66' '1.08' '2.4']
 ['30' '25.67' '60' '2.33' '3.84']
 ['31' '20.59' '67' '3.88' '5.19']
 ['32' '39.84' '107.0' '3.4' '3.77']
 ['33' '29.22' '74' '1.09' '6.0900']
 ['34' '33.19' '61' '3.22' '1.74']
 ['35' '38.7' '62' '3.61' '6.52']
 ['36' '30.130' '62' '3.62' '6.83']
 ['37' '21.56' '93' '3.63' '4.43']
 ['38' '38.06' '67' '3.21' '2.41']
 ['39' '37.95' '68' '1.12' '4.56']
 ['40' '35.8' '96' '1.52' '5.54']
 ['41' '29.75' '80' '1.3' '2.23']
 ['42' '32.69' '69' '3.26' '1.43']
 ['43' '33.94' '96' '3.42' '1.4']
 ['44' '36.31' '78' '3.69' '5.34']]
箱型图是来看有没有异常值和有多少个异常值
不过看输出的图片就知道只学了点皮毛
 下面的这个就是折线图和散点图结合起来


 1049
1049


 被折叠的 条评论
为什么被折叠?
被折叠的 条评论
为什么被折叠?
 到【灌水乐园】发言


