


1、单独应用在一个QWidget中。
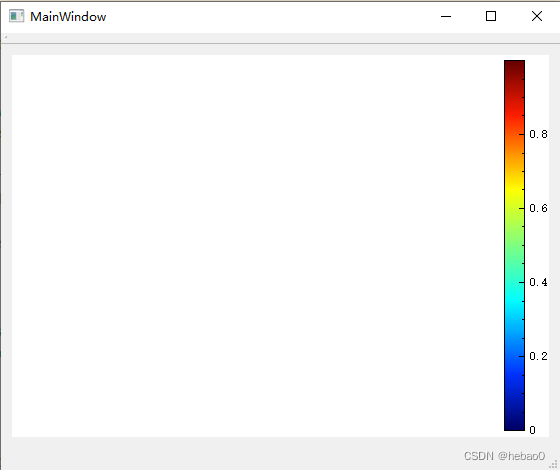
通过新建一个瀑布图后移除瀑布图即可只留住色度条。
    QCustomPlot *customPlot = ui->widget;
    QCPColorScale *colorScale = new QCPColorScale(customPlot);
    customPlot->plotLayout()->addElement(0, 1, colorScale); // add it to the right of the main axis rect
    colorScale->setType(QCPAxis::atRight); // scale shall be vertical bar with tick/axis labels right (actually atRight is already the default)
//    colorScale->axis()->setLabel("Magnetic Field Strength");

    colorScale->setGradient(QCPColorGradient::gpJet);
    colorScale->setDataRange(QCPRange(0,1));

    customPlot->plotLayout()->remove(customPlot->axisRect());
    customPlot->replot();
运行后
2、将瀑布图色度条移动至瀑布图内。
先上代码
if(nullptr == m_pColorScale)
    {
        m_pColorScale = new QCPColorScale(fp3);
        m_pColorScale->setDataRange(QCPRange(0,50));//百分比
        m_pColorScale->setType(QCPAxis::atBottom);
//        m_pColorScale->axis()->setOffset(-18);


        m_pColorScale->axis()->setVisible(true);
        m_pColorScale->axis()->setTickLength(5,0);
        m_pColorScale->axis()->setSubTickLength(0,0);


        QFont font;
        font.setFamily(QStringLiteral("黑体"));
        font.setBold(true);
        m_pColorScale->axis()->setTickLabelFont(font);

        m_pColorScale->axis()->setNumberFormat("gbc");//g灵活的格式,b漂亮的指数形式,c乘号改成×
        m_pColorScale->axis()->setNumberPrecision(2);//精度1
        m_pColorScale->axis()->ticker()->setTickCount(4);
        m_pColorScale->axis()->ticker()->setTickStepStrategy(QCPAxisTicker::tssMeetTickCount);

        m_pColorScale->setRangeDrag(true);
        m_pColorScale->setRangeZoom(true);

        fp3->axisRect()->insetLayout()->addElement(m_pColorScale,QRectF(0,0.95,1,1));
        m_pColorMap->setColorScale(m_pColorScale);

    }
重点是最后这一句
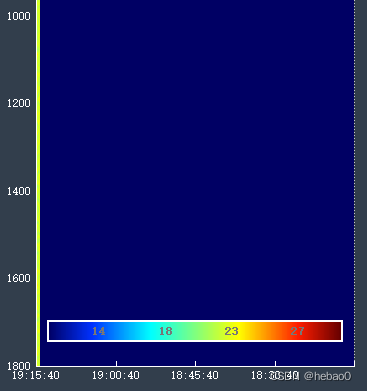
fp3->axisRect()->insetLayout()->addElement(m_pColorScale,QRectF(0,0.95,1,1));
这句话的作用是将色度条放入瀑布图框中。效果图如图。
原理解析:
首先应该参考我的另一篇文章介绍了QCustomPlot 的刷新原理。
1、色度条的深度理解
可以把它看成一个QCPAxisRect (矩形框)和一张底色图的结合体。官方采用的是QCPColorScaleAxisRectPrivate这个类,通过调用这个类的draw 函数进行刷新底色值及矩形框。色度条上的数值可以看成矩形框的x轴数值,色度条的边框可以看成是矩形框的坐标轴。通过下列代码可以获取到坐标轴,开发者就是这么设计的。
m_pColorScale->axis()->axisRect()->axis(QCPAxis::atRight)->setBasePen(QPen(Qt::white, 2));
        m_pColorScale->axis()->axisRect()->axis(QCPAxis::atLeft)->setBasePen(QPen(Qt::white, 2));
        m_pColorScale->axis()->axisRect()->axis(QCPAxis::atTop)->setBasePen(QPen(Qt::white, 2));
2、矩形框的深度理解(QCPAxisRect)
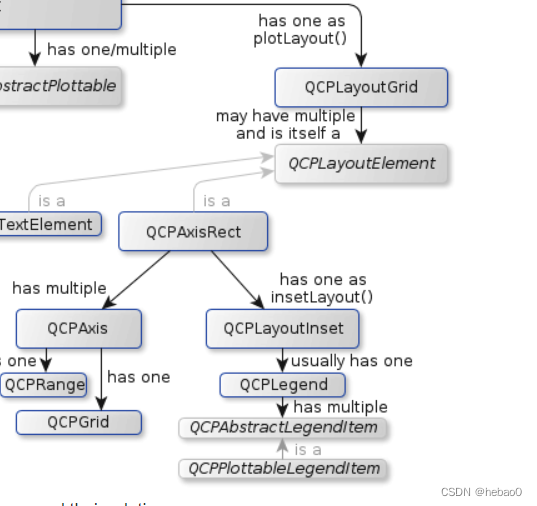
矩形框中包含一个QCPLegend,这个legend 是怎么画到矩形框中的呢,通过查看源码
 legend = new QCPLegend;
  legend->setVisible(false);
  defaultAxisRect->insetLayout()->addElement(legend, Qt::AlignRight|Qt::AlignTop);
  defaultAxisRect->insetLayout()->setMargins(QMargins(12, 12, 12, 12));
是通过一个insetLayout 添加上去的,QCustomer中的元素都是在布局中存在的,为了放置一个legend,一个QCPAxisRect默认带一个QCPLayoutInset,这个布局默认是为了放置图例,这里我们可以在这个布局上添加一个色度条。


 4090
4090


 被折叠的 条评论
为什么被折叠?
被折叠的 条评论
为什么被折叠?
 到【灌水乐园】发言


