


 这篇博客详细介绍了如何使用Python进行动态机械系统中杆件的运动学和动力学计算。通过定义点和杆的类,实现了计算杆末端坐标、速度和加速度的算法,并构建了二级杆组(RRR_II_rods_group)类来处理更复杂的连接。最终,通过实例展示了如何计算特定角度下的结果,并利用matplotlib进行图形化展示,动态呈现杆件末端的轨迹、速度和加速度随角度变化的情况。
题目要求

公式推导和计算

计算流程图

python代码
import math
from os import close, error, system
from numpy.lib.function_base import copy, place, select, vectorize
import matplotlib.pyplot as plt
import numpy as np
#定义类,点
class point():
#定义点的基本属性
def __init__(self,x=0,y=0,vx=0,vy=0,ax=0,ay=0):
self.x=x
self.y=y
self.vx=vx
self.vy=vy
self.ax=ax
self.ay=ay
#定义类杆
class rod():
#定义杆的基本属性
def __init__(self,phi=0,length=0,omega=0,alpha=0):
self.phi=phi
self.length=length
self.omega=omega
self.alpha=alpha
#定义类 一级杆
class I_rod():
p0:point
def __init__(self,s_Point:point,Rod:rod):
#计算杆末端的x坐标
x=s_Point.x+Rod.length*math.cos(Rod.phi)
#计算杆末端的y坐标
y=s_Point.y+Rod.length*math.sin(Rod.phi)
#计算杆末端的x方向速度,长度单位换算成米
vx=s_Point.vx-(Rod.omega*Rod.length*math.sin(Rod.phi))/1000
#计算杆末端的y方向速度,长度单位换算成米
vy=s_Point.vy+(Rod.omega*Rod.length*math.cos(Rod.phi))/1000
#计算杆末端的x方向加速度,长度单位换算成米
ax=s_Point.ax-(Rod.omega**2*Rod.length*math.cos(Rod.phi)\
+Rod.alpha*Rod.length*math.sin(Rod.phi))/1000
#计算杆末端的y方向加速度,长度单位换算成米
ay=s_Point.ay-(Rod.omega**2*Rod.length*math.sin(Rod.phi)\
-Rod.alpha*Rod.length*math.cos(Rod.phi))/1000
self.p0=point(x,y,vx,vy,ax,ay)
#返回末端对象
def get_e_point(self):
return self.p0
#定义类RRR 二级杆组
class RRR_II_rods_group():
point_0:point
def __init__(self,p1:point,p2:point,r1_length:float,r2_length:float,clockwise=True):
#clockwise:p1,所求点p0,p2是否是顺时针排布
self.point_1=p1
self.point_2=p2
self.rod_1=rod(length=r1_length)
self.rod_2=rod(length=r2_length)
self.__length_BD=math.sqrt((p1.x-p2.x)**2+(p1.y-p2.y)**2)
if(self.__length_BD>r1_length+r2_length or \
self.__length_BD<abs(r1_length-r2_length)):
raise Exception("在某一位置,杆长不满足装配要求")
self.clockwise=clockwise
#计算phi_1
A0=2*r1_length*(p2.x-p1.x)
B0=2*r2_length*(p2.y-p2.y)
C0=r1_length**2+(p1.x-p2.x)**2+(p1.y-p2.y)**2-r2_length**2
if (self.clockwise):
f=1
else:
f=-1
self.rod_1.phi=2*math.atan((B0+f*math.sqrt(A0**2+B0**2-C0**2))/(A0+C0))
#实例化point_0对象
self.point_0=I_rod(p1,self.rod_1).get_e_point()
#计算phi_2
self.rod_2.phi=math.atan((self.point_0.y-p2.y)/(self.point_0.x-p2.x))
#计算omega_1和omega_2
C_1=r1_length*math.cos(self.rod_1.phi)
S_1=r1_length*math.sin(self.rod_1.phi)
C_2=r2_length*math.cos(self.rod_2.phi)
S_2=r2_length*math.sin(self.rod_2.phi)
G_1=C_1*S_2-C_2*S_1
self.rod_1.omega=(C_2*(p2.vx-p1.vx)+S_2*(p2.vy-p1.vy))/G_1*1000
self.rod_2.omega=(C_1*(p2.vx-p1.vx)+S_1*(p2.vy-p1.vy))/G_1*1000
#计算alpha_1和alpha_2
G_2=1000*(p2.ax-p1.ax)+self.rod_1.omega**2*C_1-self.rod_2.omega**2*C_2
G_3=1000*(p2.ay-p1.ay)+self.rod_1.omega**2*S_1-self.rod_2.omega**2*S_2
self.rod_1.alpha=(G_2*C_2+G_3*S_2)/G_1
self.rod_2.alpha=(G_2*C_1+G_3*S_1)/G_1
#重新赋值point_0
self.point_0=I_rod(p1,self.rod_1).get_e_point()
def get_p0(self):
return self.point_0
def get_r1(self):
return self.rod_1
def get_r2(self):
return self.rod_2
#主函数
if(__name__=="__main__"):
#定义已知参数
l_AB=80
l_BC=140
l_CD=150
l_AD=200
l_BE=50
l_EF=45
omega=100
l_BF=math.sqrt(l_EF**2+l_BE**2)
theta=math.atan(l_EF/l_BE)
point_A=point()
point_D=point(x=l_AD)
x_data=[]
y_data=[]
vx_data=[]
vy_data=[]
ax_data=[]
ay_data=[]
for i in range(0,360):
phi=i*math.pi/180
rod_AB=rod(phi,l_AB,omega)
point_B=I_rod(point_A,rod_AB).get_e_point()
rod_BC=RRR_II_rods_group(point_B,point_D,l_BC,l_CD).get_r1()
rod_BF=rod(theta+rod_BC.phi,l_BF,rod_BC.omega,rod_BC.omega)
point_F=I_rod(point_B,rod_BF).get_e_point()
x_data.append(point_F.x)
y_data.append(point_F.y)
vx_data.append(point_F.vx)
vy_data.append(point_F.vy)
ax_data.append(point_F.ax)
ay_data.append(point_F.ay)
#显示图像
plt.figure(figsize=(21,13), dpi=80)
ax1=plt.subplot2grid((7,11),(0,0),colspan=4,rowspan=7)
ax1 = plt.gca()
ax1.set_aspect(1)
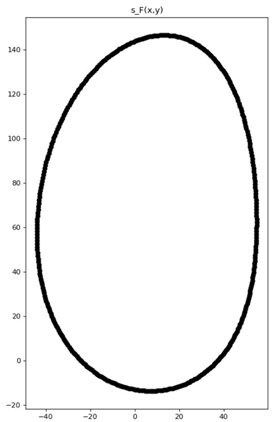
ax1.set_title("s_F(x,y)")
ax1.scatter(x_data,y_data,color="black")
phi_x=np.linspace(0,2*math.pi,360)
ax2=plt.subplot2grid((7,11),(0,4),colspan=3,rowspan=3)
ax2 = plt.gca()
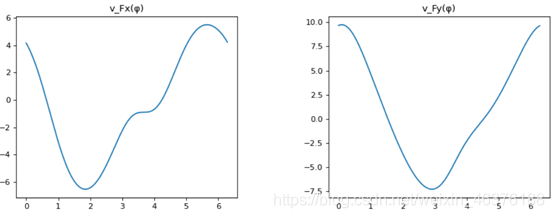
ax2.set_title("v_Fx(φ)")
ax2.plot(phi_x,vx_data)
ax3=plt.subplot2grid((7,11),(0,8),colspan=3,rowspan=3)
ax3 = plt.gca()
ax3.set_title("v_Fy(φ)")
ax3.plot(phi_x,vy_data)
ax4=plt.subplot2grid((7,11),(4,4),colspan=3,rowspan=3)
ax4 = plt.gca()
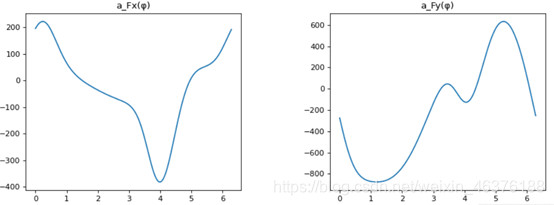
ax4.set_title("a_Fx(φ)")
ax4.plot(phi_x,ax_data)
ax5=plt.subplot2grid((7,11),(4,8),colspan=3,rowspan=3)
ax5 = plt.gca()
ax5.set_title("a_Fy(φ)")
ax5.plot(phi_x,ay_data)
plt.show()
生成图表一览


 4230
4230

 被折叠的 条评论
为什么被折叠?
被折叠的 条评论
为什么被折叠?
 到【灌水乐园】发言


