


OLS抽样分布模拟(Python)
文章目录
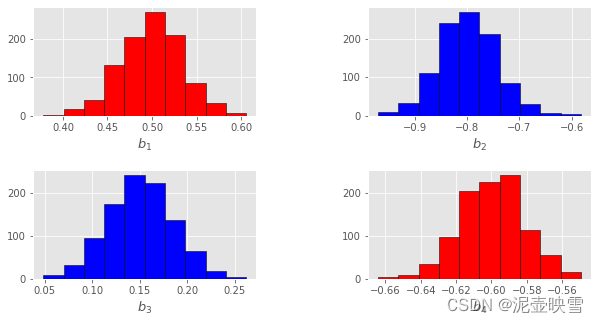
之前的推文使用R语言对OLS估计量进行模拟,这次Python进行蒙特卡洛模拟,代码如下。没想到Python也有ggplot,作图非常好看。以后可能会使用Stata+R+Matlab+Python了。
import numpy as np
import pandas as pd
import statsmodels.formula.api as smf
import scipy.stats as stats
import matplotlib.pyplot as plt
# 随机种子
np.random.seed(110)
# 样本量n和模拟次数r
n = 100;r = 1000
# 设定总体参数
beta0 = 1;beta1 = 0.5
beta2 = -0.8;beta3 = 0.15;beta4 = -0.6
# initialize b0 and b1 to store results later:
b0 = np.empty(r)
b1 = np.empty(r)
b2 = np.empty(r)
b3 = np.empty(r)
b4 = np.empty(r)
# repeat r times:
for i in range(r):
    # draw a sample:
    x1 = stats.norm.rvs(loc=1,scale=3,size=n)
    x2 = stats.norm.rvs(loc=0,scale=2,size=n)
    x3 = stats.norm.rvs(loc=-1,scale=3,size=n)
    u = stats.norm.rvs(loc = 0,scale=1,size=n)
    y = beta0 + beta1 * x1 + beta2 * x2  + beta3 * x3  + beta4 * x1 * x2   + u
    mydata = pd.DataFrame({'y': y, 'x1': x1,'x2':x2, 'x3': x3, 'x12': x1*x2,})
    # estimate OLS:
    reg = smf.ols(formula="y ~ x1+x2+x3+x12", data=mydata)
    results = reg.fit()
    b0[i] = results.params['Intercept']
    b1[i] = results.params['x1']
    b2[i] = results.params['x2']
    b3[i] = results.params['x3']
    b4[i] = results.params['x12']
# ggplot
plt.style.use('ggplot')
# 宽高设定
plt.figure(figsize=(10, 5))
plt.subplots_adjust(left=None, bottom=None,
                    right=None, top=None, wspace=0.5, hspace=0.5)
# 打印直方图
plt.subplot(221)
plt.hist(b1,color = "red",edgecolor = 'black')
# 可以使用latex语法添加数学符号
plt.xlabel(r'$b_1$',fontsize=13)
plt.subplot(222)
plt.hist(b2,color = "blue",edgecolor = 'black')
plt.xlabel(r'$b_2$',fontsize=13)
plt.subplot(223)
plt.hist(b3,color = "blue",edgecolor = 'black')
plt.xlabel(r'$b_3$',fontsize=13)
plt.subplot(224)
plt.hist(b4,color = "red",edgecolor = 'black')
plt.xlabel(r'$b_4$',fontsize=13)
plt.savefig("test.svg")
plt.show()


 1561
1561


 被折叠的 条评论
为什么被折叠?
被折叠的 条评论
为什么被折叠?
 到【灌水乐园】发言


