


1.散点图 + 回归
proc  sgplot  data=sashelp.class;
      scatter  x=height y=weight;
      reg  x=height y=weight/cli clm;
run;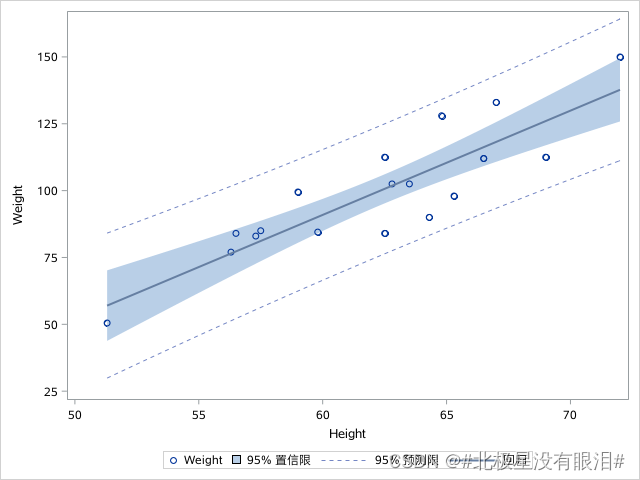
2.条形图
proc  sgplot data=sashelp.class;
	vbar  sex/respose=weight;
run;
3.箱线图
proc  sgplot  data=sashelp.class;
	vbox age;
quit;
proc  sgplot  data=sashelp.class;  /*分组箱线图*/
	vbox age/group=sex;
quit; 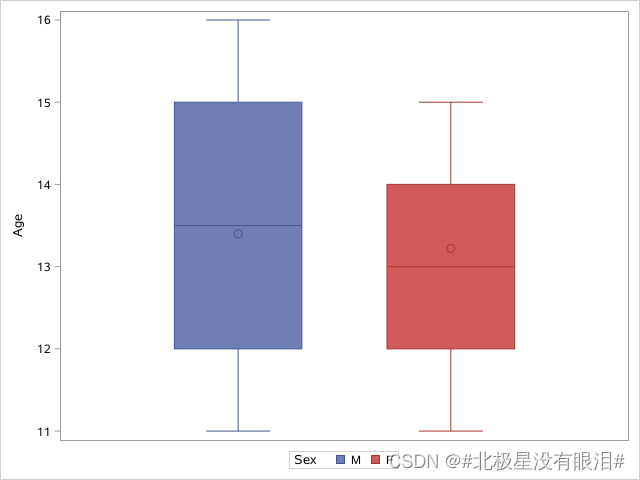
4.折线图
proc  sgplot  data=sashelp.stocks(where=(Stock="IBM"));  /*折线图*/
	series x=date  y=close;
quit;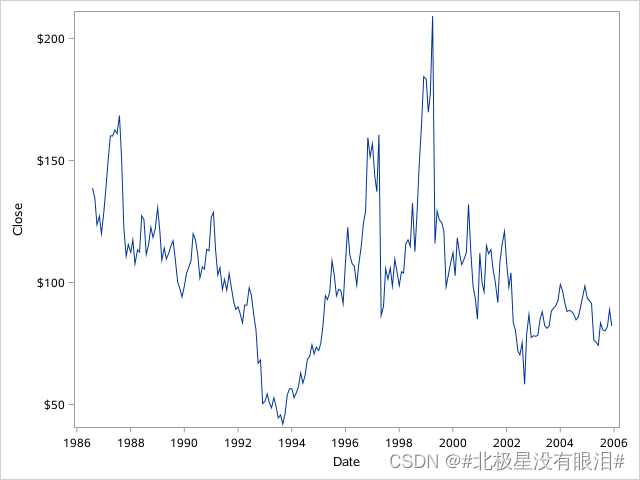


 2万+
2万+


 被折叠的 条评论
为什么被折叠?
被折叠的 条评论
为什么被折叠?
 到【灌水乐园】发言


