


最近在弄一个数据小工具,最终要生成一个报表类的文件,这里记录下怎样使用plotly做的表格并转为html格式的,并用jinja2写入到html模板中去。
处理好的pandas.DateFrame数据:
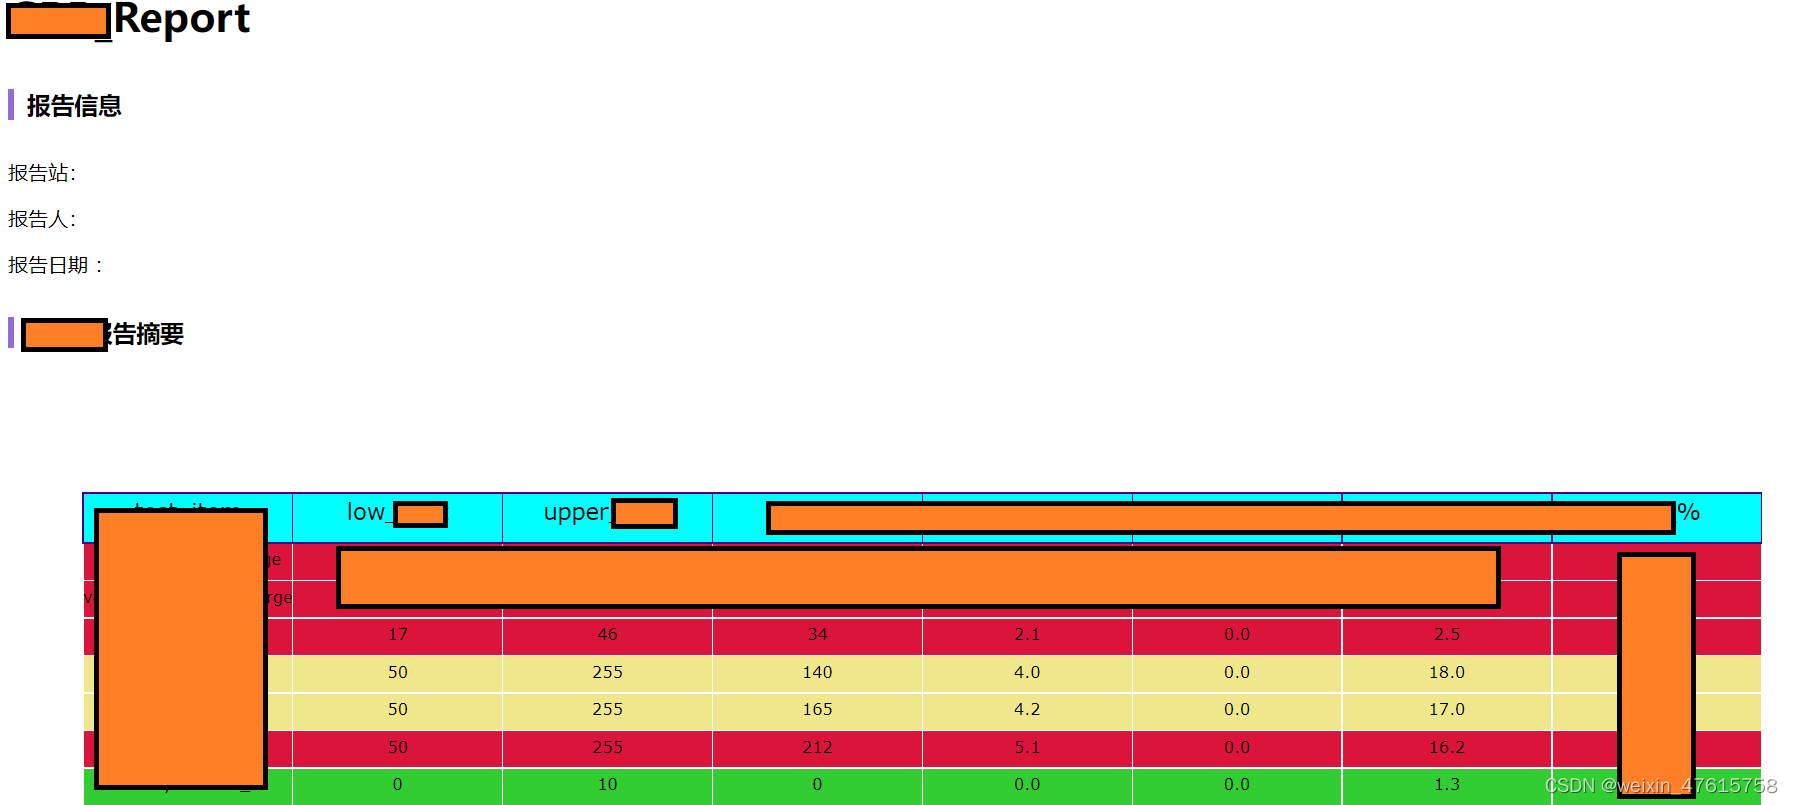
    test_item  low        upper        ...       AV       TV   _%
0      charge  4600000.0    5250000.0  ...  15306    94734.9  47.49%
1   discharge  4600000.0    5250000.0  ...      0.0  37567.5  97.27%
......
python 代码:
# re = ff.create_table(report, font_colors=col).to_html() # 第一种create_table方法直接通过DataFrame格式转换,没有找到单独一行背景色的设置方法,这里不太使用。
    # re = go.Figure(data=[go.Table(
    #     header=dict(values=list(report),  #设置header表头的值
    #                 line_color='indigo',   # 颜色
    #                 fill_color='aqua',
    #                 align='center',       #对齐方式??
    #                 font=dict(color='black', size=18),  #字体
    #                 height=40),   #  高度
    #     cells=dict(values=[report['test_item'], report['low'],report['upper'], report['。。'], report['..'], report['..'], report['..'],report['_%']], #设置表格数据直接pandas获取
    #                line_color='white',
    #                fill_color=[col],#设置颜色列表,可以单独设置每行
    #                align='center',
    #                font=dict(color='black',size=13),
    #                height=30
    #                ))])
    # env = Environment(loader=FileSystemLoader("./"))
    # template = env.get_template("temp.html")  #加载一个html的模板
    # with open('out.html', 'w+', encoding='utf-8') as f:
    #     out = template.render(report_summary=re.to_html()) #转换好的表格转换为html格式并使用jinja2模块写入
    #     f.write(out)#
最终的结果, 不会html 所以布局有点简陋,不过是内部使用外观要求不高。
plotly 图片同理,如果表格数据过多会自动生成滑块,这对于html 转PDF时表格图片会保存不全,目前还没找到解决方法。
其他的可以参考知乎的文章:神器Jinja2,用 Python 快速生成分析报告 - 知乎


 1968
1968


 被折叠的 条评论
为什么被折叠?
被折叠的 条评论
为什么被折叠?
 到【灌水乐园】发言


