option = {
  xAxis: {
    type: 'category',
    data: ['Mon', 'Tue', 'Wed', 'Thu', 'Fri', 'Sat', 'Sun']
  },
  yAxis: {
    type: 'value'
  },
  series: [
    {
      data: [150, 230, 224, 218, 135, 147, 260],
      type: 'line',
      label: {//显示折现的值
        show: true,
        color: '#000000',
        backgroundColor: 'transparent'//隐藏背景颜色不然感觉有描边
      },
      // 上下限制
      markLine: {
        symbolSize: 0,//不展示上下限两边的图标
        data: [
          {
            lineStyle: {
              color: '#ffc000',
              width: 3
            },
            yAxis: 200,//控制限制刻度
            label: { show: true, position: 'end', formatter: '上限' }
          },
          {
            lineStyle: {
              color: '#4f81bd',
              width: 3
            },
            yAxis: 100,
            label: { show: true, position: 'end', formatter: '下限' }
          }
        ]
      }
    }
  ]
};
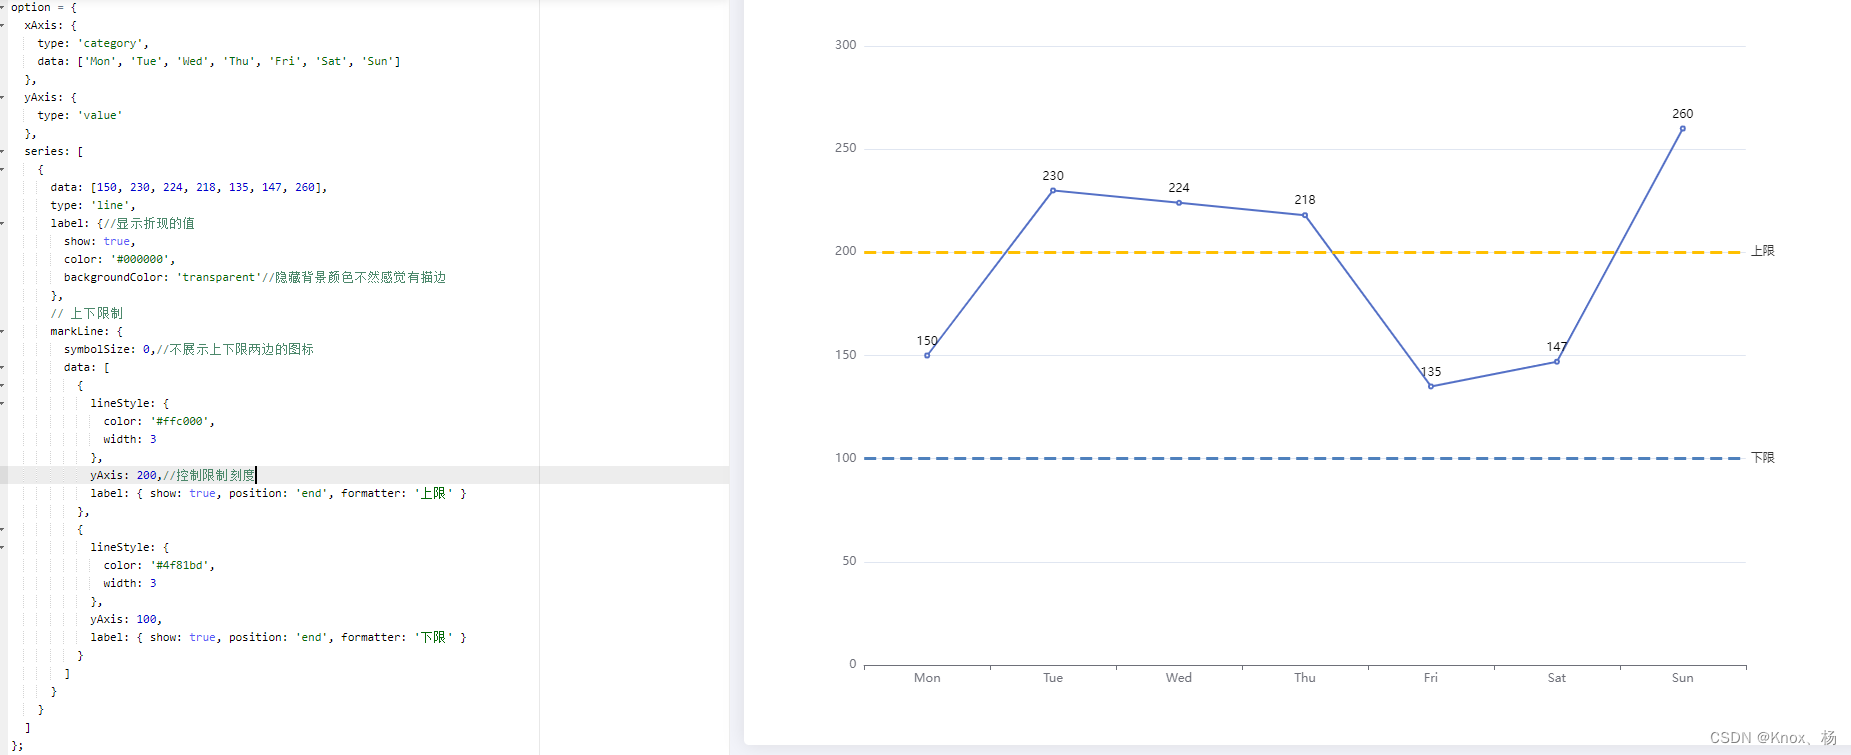


 文章详细描述了如何使用JavaScript在图表库中创建一个带有时间序列数据的折线图,展示了如何设置X轴和Y轴,以及如何添加上下限制线来表示数据的范围。


 3398
3398

 被折叠的 条评论
为什么被折叠?
被折叠的 条评论
为什么被折叠?
 到【灌水乐园】发言


