1:创建echarts.vue组件
<template>
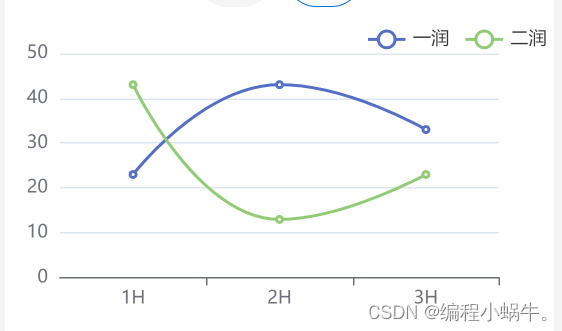
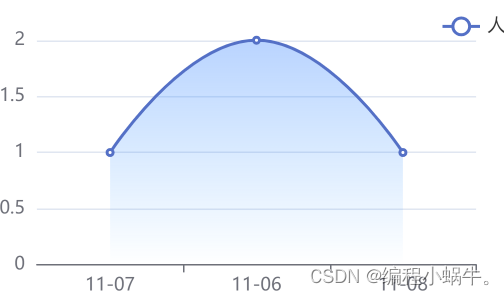
<view>
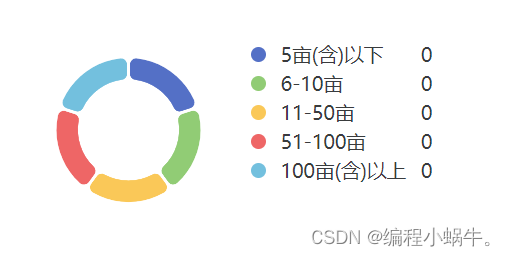
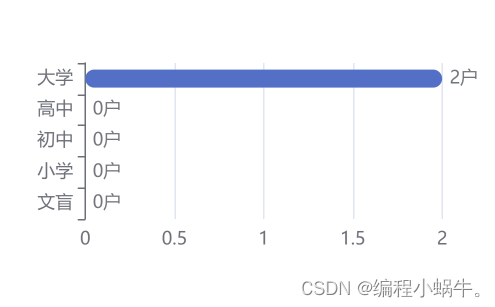
<view
class="echarts"
:id="option.id"
:prop="option"
:change:prop="echarts.update"
@click="echarts.onClick"
></view>
</view>
</template>
<script>
export default {
name: 'Echarts',
props: {
option: {
type: Object,
required: true,
},
isMap: Boolean,
},
created() {
// 设置随机数id
let t = 'ABCDEFGHIJKLMNOPQRSTUVWXYZabcdefghijklmnopqrstuvwxyz0123456789';
let id = '';
for (let i = 0; i < 32; i++) {
id += t.charAt(Math.floor(Math.random() * t.length));
}
this.option.id = id;
},
methods: {
/**
* renderjs内的点击事件,回调到父组件
* @param {Object} params
*/
onViewClick(params) {
this.$emit('onClick', params);
},
},
};
</script>
<script module="echarts" lang="renderjs">
import * as echarts from 'echarts';
echarts.env.touchEventsSupported = false;
echarts.env.wxa = false;
import getMapGeo from "@/pages-tbi/components/index.js";
export default {
data() {
return {
chart: null,
clickData: null // echarts点击事件的值
}
},
mounted() {
if (typeof window.echarts === 'object') {
this.init()
} else {
// 动态引入类库
const script = document.createElement('script')
// script.src = 'echarts/echarts.min.js'
script.onload = this.init()
document.head.appendChild(script)
}
},
methods: {
/**
* 初始化echarts
*/
init() {
// 根据id初始化图表
this.chart = echarts.init(document.getElementById(this.option.id))
this.$emit('myChart', this.chart)
this.update(this.option)
// echarts的点击事件
this.chart.on('click', params => {
// 把点击事件的数据缓存下来
this.clickData = params
})
},
/**
* 点击事件,可传递到外部
* @param {Object} event
* @param {Object} instance
*/
onClick(event, instance) {
if (this.clickData) {
console.log(this.clickData)
// 把echarts点击事件相关的值传递到renderjs外
instance.callMethod('onViewClick', this.clickData.data)
// 上次点击数据置空
this.clickData = null
}
},
/**
* 监测数据更新
* @param {Object} option
*/
update(option) {
let op = this.deepCopy(option)
if (this.chart) {
// 因App端,回调函数无法从renderjs外传递,故在此自定义设置相关回调函数
if (op) {
// 根据名名称动态引入GEO.JS文件
if(op.series && op.series[0].type == 'map'){
echarts.registerMap('fujian', getMapGeo.getMapGeo(op.mapName));
}
// tooltip
if (op.tooltip) {
// 判断是否设置tooltip的位置
if (op.tooltip.positionStatus) {
op.tooltip.position = this.tooltipPosition()
}
// 判断是否格式化tooltip
if (op.tooltip.formatterStatus) {
op.tooltip.formatter = this.tooltipFormatter(op.tooltip.formatterUnit, op.tooltip.formatFloat2, op.tooltip.formatThousands)
}
}
// 颜色渐变
if (op.series) {
for (let i in op.series) {
let linearGradient = op.series[i].linearGradient
if (linearGradient) {
op.series[i].color = new echarts.graphic.LinearGradient(linearGradient[0],linearGradient[1],linearGradient[2],linearGradient[3],linearGradient[4])
}
}
}
}
if(op.series && op.series[0].type == 'map' && !op.isBigFarmland){
// 重设formatter
op.series[0].label.formatter = (v) => {
let label;
if (v.value) {
label = `{name|${v.name}}\n{value|${v.value || 0}${v.data.unit}}`;
} else {
label = `{name|${v.name}}`;
}
return label;
}
} else if( op.series && op.series[0].type == 'map' && op.isBigFarmland) {
// 重设formatter
op.series[0].label.formatter = (v) => {
let label;
if (v.data && v.data.value && v.data.value !== "0") {
label = `{name|${v.name}}\n{value|${v.data.value}}`;
if(op.isBuyBoard){
label = `{name|${v.name}}\n{value|${v.data.value}%}`;
}
} else {
label = `{name|${v.name}}`;
}
return label;
}
}
// 清除旧的
this.chart.clear();
// 设置新的option
this.chart.setOption(op, op.notMerge)
// 返回颜色数组
console.log('图标option',this.chart.getModel()?.option)
this.$emit('color',this.chart.getModel()?.option.color)
}
},
/**
* 设置tooltip的位置,防止超出画布
*/
tooltipPosition() {
return (point, params, dom, rect, size) => {
// 其中point为当前鼠标的位置,size中有两个属性:viewSize和contentSize,分别为外层div和tooltip提示框的大小
let x = point[0]
let y = point[1]
let viewWidth = size.viewSize[0]
let viewHeight = size.viewSize[1]
let boxWidth = size.contentSize[0]
let boxHeight = size.contentSize[1]
let posX = 0 // x坐标位置
let posY = 0 // y坐标位置
if (x >= boxWidth) { // 左边放的下
posX = x - boxWidth - 1
}
if (y >= boxHeight) { // 上边放的下
posY = y - boxHeight - 1
}
return [posX, posY]
}
},
/**
* tooltip格式化
* @param {Object} unit 数值后的单位
* @param {Object} formatFloat2 是否保留两位小数
* @param {Object} formatThousands 是否添加千分位
*/
tooltipFormatter(unit, formatFloat2, formatThousands) {
return params => {
let result = ''
unit = unit ? unit : ''
for (let i in params) {
if (i == 0) {
result += params[i].axisValueLabel
}
let value = '--'
if (params[i].data !== null) {
value = params[i].data
// 保留两位小数
if (formatFloat2) {
value = this.formatFloat2(value)
}
// 添加千分位
if (formatThousands) {
value = this.formatThousands(value)
}
}
// #ifdef H5
result += '\n' + params[i].seriesName + ':' + value + ' ' + unit
// #endif
// #ifdef APP-PLUS
result += '<br/>' + params[i].marker + params[i].seriesName + ':' + value + ' ' + unit
// #endif
}
return result
}
},
/**
* 保留两位小数
* @param {Object} value
*/
formatFloat2(value) {
let temp = Math.round(parseFloat(value) * 100) / 100
let xsd = temp.toString().split('.')
if (xsd.length === 1) {
temp = (isNaN(temp) ? '0' : temp.toString()) + '.00'
return temp
}
if (xsd.length > 1) {
if (xsd[1].length < 2) {
temp = temp.toString() + '0'
}
return temp
}
},
/**
* 添加千分位
* @param {Object} value
*/
formatThousands(value) {
if (value === undefined || value === null) {
value = ''
}
if (!isNaN(value)) {
value = value + ''
}
let re = /\d{1,3}(?=(\d{3})+$)/g
let n1 = value.replace(/^(\d+)((\.\d+)?)$/, function(s, s1, s2) {
return s1.replace(re, '$&,') + s2
})
return n1
},
deepCopy(obj) {
var o;
// 如果 他是对象object的话 , 因为null,object,array 也是'object';
if (typeof obj === 'object') {
// 如果 他是空的话
if (obj === null) {
o = null;
}
else {
// 如果 他是数组arr的话
if (obj instanceof Array) {
o = [];
for (var i = 0, len = obj.length; i < len; i++) {
o.push(this.deepCopy(obj[ i ]));
}
}
// 如果 他是对象object的话
else {
o = {};
for (var j in obj) {
o[ j ] = this.deepCopy(obj[ j ]);
}
}
}
}
else {
o = obj;
}
return o;
}
}
}
</script>
<style lang="scss" scoped>
.echarts {
width: 100%;
height: 100%;
}
</style>
2:在项目中引用 折线图
<template>
	<view>
        <!-- 注意页面需要给echarts设置高。否则会报错,图出不来-->
          <Echarts :option="preOption" class="echarts1"></Echarts>
    </view>
</template>
<script>
    import Echarts from '../../components/echarts.vue'; //这里需根据自己目录选择
    export default {
        components: {
        Echarts,
    	},
        data(){
            return {
                preOption:{},
            }
        },
        methods: {
            getOptionData() {
                //此处从后端获取数据 返回。后端数据格式写在后面
                //一般情况是 res.dataset
                this.initEchart(dataset);
            },
            initEchart(dataset) {
                //这里的preOption 设置 就是设置你想要什么样式的Echarts了
                //具体可以参考官网。此处是折线图
                this.preOption = {
                grid: { left: '10%', bottom: '18%', top: '10%' },
                tooltip: {
                    trigger: 'axis',
                },
                legend: {
                    y: 'top',
                    x: 'right',
                },
                xAxis: {
                    type: 'category',
                },
                yAxis: {
                    type: 'value',
                },
                dataset: dataset,
                series: [
                    {
                        center: ['30%', 'center'],
                        type: 'line',
                        smooth: true,
                        //此为折线图 下方带背景颜色设置
                       // areaStyle: {
                        //     color: {
                        //         type: 'linear',
                        //         x: 0,
                        //         y: 0,
                        //         x2: 0,
                        //         y2: 1,
                        //         colorStops: [{
                        //             offset: 0, color: 'rgba(58,132,255, 0.5)'    // 0% 处的颜色
                        //         }, {
                        //             offset: 1, color: 'rgba(30,144,255,0)' //   100% 处的颜色
                        //         }],
                        //         global: false // 缺省为 false
                        //     }
                        // },
                    },
                ],
            };
            }
        }
    }
</script>
<style lang="scss" scoped>
    .echarts1 {
        width: 100%;
        height: 400rpx;
	}
</style>
3:饼图 中间镂空 ,如果不想镂空设置 series 中radius 属性即可和柱状图
<template>
	<view>
        <!-- 注意页面需要给echarts设置高。否则会报错,图出不来-->
         <view class="order-contain">
          <view class="pie-info">
            <yh-echarts :option="typeOption" class="echarts1 e-m-t-20"></yh-echarts>
              <!--以下view部分 无需关注 展示例子用-->
            <view style="margin-bottom: 80rpx">
              <view class="legend-list" v-for="(item, key) in data3" :key="key">
                <view class="name">
                  <view class="name-i">
                    <i class="icon" :style="{ background: colors[key] + ' !important' }" />
                    <span>{{ item.product }}</span>
                  </view>
                  <span>{{ item['占比'] + '%' }}</span>
                </view>
              </view>
            </view>
          </view>
        </view>
    </view>
</template>
<script>
    import Echarts from '../../components/echarts.vue'; //这里需根据自己目录选择
    const getPieOption = (dataset = {}, title) => {// 饼图
      return {
        tooltip: {
          trigger: 'item',
          formatter: '{b}:{d}%',
        },
        title: {
          subtext: title,
          x: 'center',
          y: '30%',
          subtextStyle: {
            color: '#333',
            fontSize: '10',
          },
        },
        // 图例
        graphic: {
          type: 'text',
          left: 'center',
          top: 'middle',
          silent: true,
          invisible: dataset.source.length, //是否可见,这里的意思是当没有数据时可见
          style: {
            fill: '#000',
            text: '',
            fontSize: '16',
          },
        },
        dataset: dataset,
        series: [
          {
            type: 'pie',
            radius: ['40%', '60%'],
            center: ['center', '42%'],
            itemStyle: {
              borderRadius: 5,
              borderColor: '#fff',
              borderWidth: 2,
            },
            labelLine: {
              show: false,
            },

            label: {//饼图中间文字设置
              normal: {
                show: false,
                position: 'center',
                formatter: '',
              },
              emphasis: {//中间文字显示
                show: true,
              }
            }
          },
        ],
      };
	};
    const getBarOption = (dataset = {}) => {
      return {
        dataset: dataset,
        xAxis: {
          type: 'value',
        },
        yAxis: {
          type: 'category',
        },
        grid: {
          left: '25%',
        },
        series: [
          {
            type: 'bar',
            barWidth: '12',
            itemStyle: {
              normal: {
                barBorderRadius: 30,
                label: {
                  show: true, //开启显示
                  position: 'right', //顶部显示
                  formatter: function (params) {
                    return params.data[params.dimensionNames[1]] + '户';
                  },
                  textStyle: {
                    //数值样式
                    color: '#727579',
                    fontSize: 12,
                  },
                },
              },
            },
          },
        ],

      };
	};
    export default {
        components: {
        Echarts,
    	},
        data(){
            return {
                getPieOption:{},//饼图
                getBarOption:{}//柱状图
                preOption:{},
            }
        },
        methods: {
            getOptionData() {
                //此处从后端获取数据 返回。后端数据格式写在后面
                //一般情况是 res.dataset
                this.preOption = getPieOption(res.dataset);

                this.preOPtion = getBarOption(res.dataset);
            },

        },
    }
</script>
<style lang="scss" scoped>
    .echarts1 {
        width: 100%;
        height: 400rpx;
	}
    .order-contain {
    margin: 0 20px;

    .pie-info {
      display: flex;
      justify-content: flex-start;
      align-items: center;
      margin-top: 10px;

      .legend-list {
        display: flex;
        flex-direction: column;
        padding: 3rpx 0;

        .name {
          font-size: 28rpx;
          display: flex;
          flex-flow: row nowrap;
          justify-content: space-between;

          .name-i {
            display: flex;
            align-items: center;
            flex-flow: row nowrap;
          }

          span {
            font-size: 13px;
            margin-right: 10px;
          }

          .icon {
            border-radius: 50%;
            height: 20rpx;
            width: 20rpx;
            margin: 0 20rpx 0 0;
            display: inline-block;
          }
        }

        .val {
          font-weight: 700;
          font-size: 28rpx;
          color: #000;
          margin-left: 42rpx;

          .num {
            width: 120px;
            display: inline-block;
          }
        }
      }
    }
  }
</style>


 2833
2833


 被折叠的 条评论
为什么被折叠?
被折叠的 条评论
为什么被折叠?
 到【灌水乐园】发言


