


一、前言
本文针对react,在react项目中使用echarts
二、前期准备
安装依赖 npm i echarts --save
三、代码注释以及效果
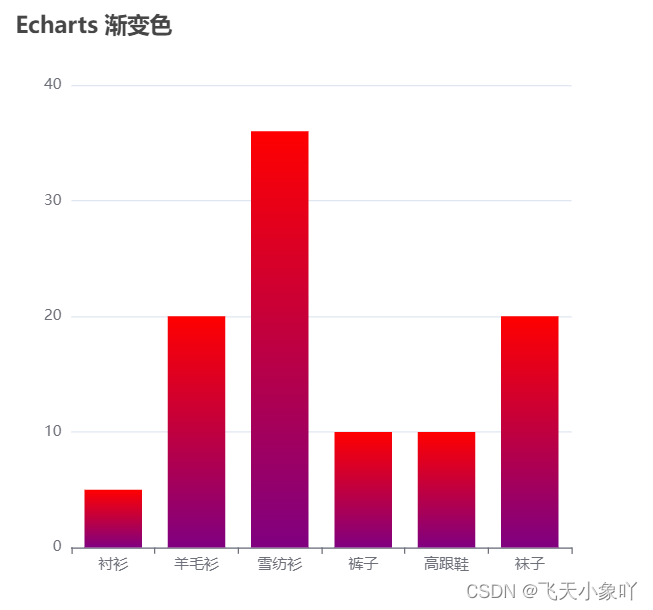
案例一:
import React, { useEffect, useRef } from 'react'
// 引入echarts包
import * as echarts from "echarts"

function App() {
  // 获得实例dom
  const dom = useRef();
  // 配置项
  const option = {
    title: {
      text: 'Echarts 渐变色'
    },
    xAxis: {
      data: ['衬衫', '羊毛衫', '雪纺衫', '裤子', '高跟鞋', '袜子']
    },
    yAxis: {},
    series: [
      {
        name: '销量',
        type: 'bar',
        data: [5, 20, 36, 10, 10, 20],
        // 设置渐变色
        itemStyle: {
          normal: {
            color: function (params) {
              return new echarts.graphic.LinearGradient(0, 0, 0, 1, [
                { offset: 0, color: "red" },
                { offset: 1, color: "purple" }
              ], false)
            }
          }
        }
      }
    ]
  }

  useEffect(() => {
  	// 初始化图例
    const chart = echarts.init(dom.current)
    // 在图例中加入配置项
    chart.setOption(option)
  }, [])

  return (
    <div className="App">
      // 一定要设置dom大小
      <div ref={dom} style={{ width: 500, height: 500 }}></div>
    </div>
  );
}

export default App;
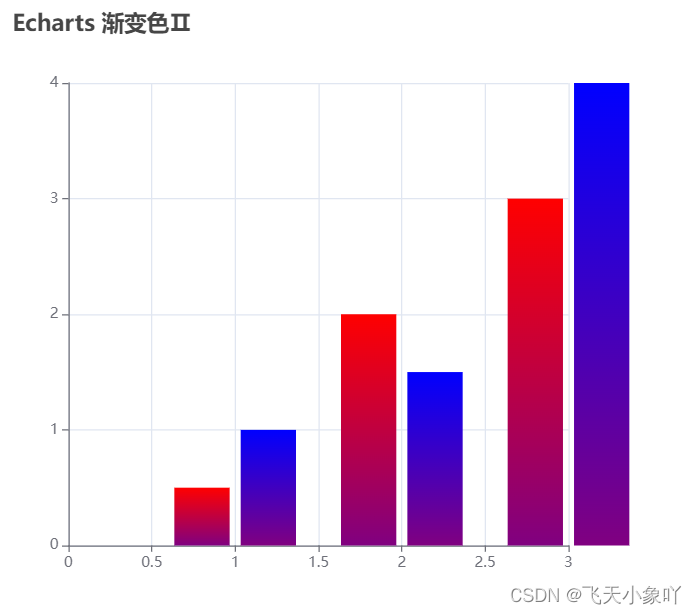
案例二:
import React, { useEffect, useRef } from 'react'
import * as echarts from "echarts"

function App() {
  // 获得实例dom
  const dom = useRef();
  // 配置项
  const option = {
    title: {
      text: 'Echarts 渐变色Ⅱ'
    },
    xAxis: {},
  	yAxis: {},
    dataset: {
      // 前面两位 第一根柱子的坐标 后面两位 第二根柱子的左边
      source: [[1, 0.5, 1, 1], [2, 2, 2, 1.5], [3, 3, 3, 4]]
    },
    series: [
      {
        type: 'bar',
        // 设置渐变色 第一条柱子
        itemStyle: {
          normal: {
            color: function (params) {
              return new echarts.graphic.LinearGradient(0, 0, 0, 1, [
                { offset: 0, color: "red" },
                { offset: 1, color: "purple" }
              ], false)
            }
          }
        }
      }, {
        type: 'bar',
        // 设置渐变色 第二条柱子
        itemStyle: {
          normal: {
            color: function (params) {
              return new echarts.graphic.LinearGradient(0, 0, 0, 1, [
                { offset: 0, color: "blue" },
                { offset: 1, color: "purple" }
              ], false)
            }
          }
        }
      }
    ]
  }

  useEffect(() => {
    const chart = echarts.init(dom.current)
    chart.setOption(option)
  }, [])

  return (
    <div className="App">
    // 一定要设置dom大小
      <div ref={dom} style={{ width: 500, height: 500 }}></div>
    </div>
  );
}

export default App;


 1358
1358


 被折叠的 条评论
为什么被折叠?
被折叠的 条评论
为什么被折叠?
 到【灌水乐园】发言


