


解决方案
参考官方:你可以选择退出默认的深度响应式/只读转换模式,并原始的,未被代理的对象嵌入状态图中。它们可以根据情况灵活运用:有些值不应该是响应式的,例如复杂的第三方类实例或vue组件对象。当渲染具有不可变数据源的大列表时,跳过proxy转换可以提高性能。
所以在实列化echart时,将期转换为非响应式即可。
import { markRaw } from "vue";
//这里的el 是我用的ref
 const el = state["chartsWrapper"];
  state.instance = markRaw(ECharts.init(el));
 // 标签用id
 const idEl=document.getElementById('id名')
  state.instance = markRaw(ECharts.init(idEl));
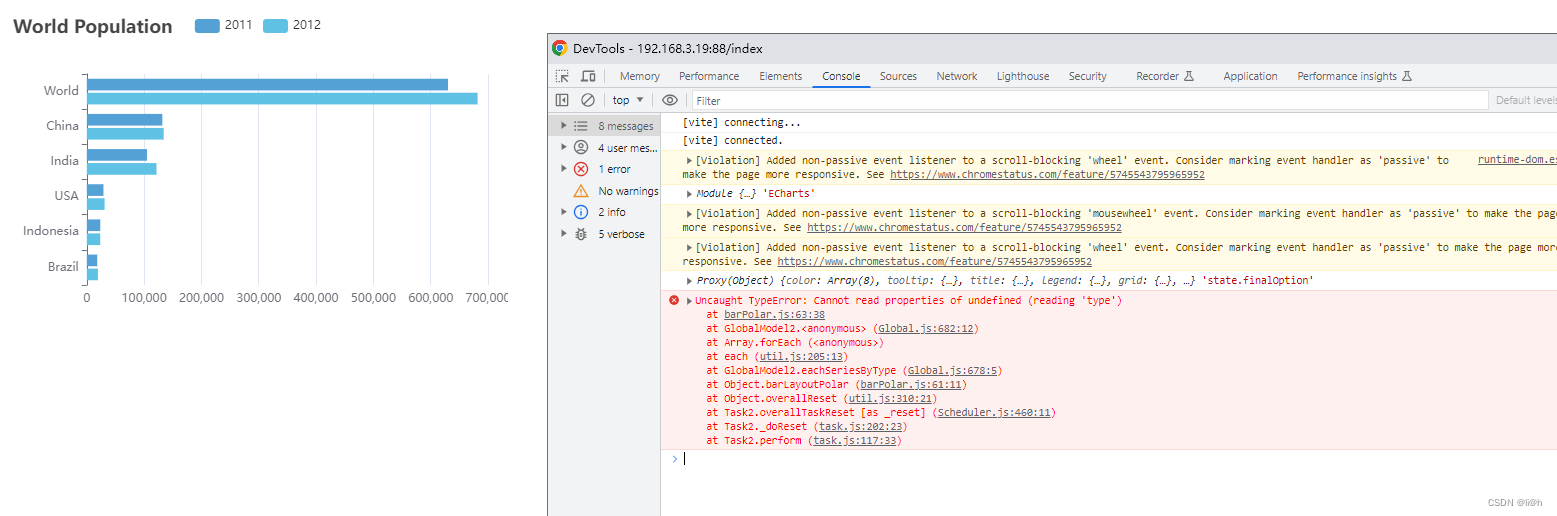
以上是遇到vue3+echart遇到的坑 Cannot read properties of undefined (reading ‘type’)
echart.vue界面代码格式
<template>
  <div class="charts-wrapper">
    <div v-show="visible" class="charts-content" ref="chartsWrapper" />
    <div v-show="!visible" class="charts-content image-wrapper">
      <div class="no-list-img" />
      <div>暂无数据</div>
    </div>
  </div>
</template>

<script>
import * as ECharts from "echarts";
import { markRaw } from "vue";
export default defineComponent({
  name:'echarts',
  props: {
    visible: {
      type: Boolean,
      default: true,
    },
    option: {
      type: Object,
      default() {
        return {};
      },
    },
  },
  emits: ["click"],
  setup(props, { emit }) {
    const state = reactive({
      instance: null,
      finalOption: {
        // 个性化配色列表
        color: [
          "#54a1d5",
          "#5fc2e5",
          "#ade4bb",
          "#fadc71",
          "#f3a385",
          "#ec7b94",
          "#e0bef0",
          "#807ae3",
          /*'#2d9ef6',
            '#4ddeef',
            '#53d55c',
            '#fae94a',
            '#f36646',
            '#ec315c',
            '#e48ce4',
            '#5f65e3'*/
        ],
        tooltip: { trigger: "axis", axisPointer: { type: "shadow" } },
      },
      timeId: null,
      chartsWrapper: null,
    });

    onMounted(() => {
      console.log(ECharts, "ECharts");
      initialize();
    });
    onUnmounted(() => {
      console.log(23423);
      state.timeId && clearTimeout(state.timeId);
      state.instance.clear();
      state.timeId = null;
      state.instance = null;
      window.removeEventListener("resize", resize);
    });
    watch(props.option.series, (newVal, olVal) => {
      paint();
    });
    const initialize = async () => {
      let _this = this;
      const el = state["chartsWrapper"];
      // 先渲染页面,后渲染图表,防止初始化图表超出容器
      // await this.$nextTick();
      // state.instance = markRaw(ECharts.init(el));
      state.instance = ECharts.init(el);

      paint(state.finalOption);
      state.instance.on("click", function (params) {
        emit("click", params);
      });
      // 新增窗口监听
      window.addEventListener("resize", resize);
    };
    // 窗口大小改变时重绘
    const resize = () => {
      // 防抖延时
      if (state.timeId) {
        clearTimeout(state.timeId);
        state.timeId = null;
      }
      state.timeId = setTimeout(() => {
        state.instance.resize();
        state.timeId = null;
      }, 300);
    };
    // 绘制图表
    const paint = async () => {
      Object.assign(state.finalOption, props.option);
      console.log(state.finalOption,'state.finalOption');
      state.instance.setOption(state.finalOption);
    };
    /**
     * 提供给外部调用,用来调用echarts实例的方法
     * @param name echarts实例方法名称
     * @param args 不定长参数列表
     */
    const instanceMethod = (name, ...args) => {
      state.instance[name](...args);
    };
    return {
      ...toRefs(state),
      initialize,
      resize,
      paint,
      instanceMethod
    };
  },
});
</script>

<style scoped lang="scss">
.charts-wrapper {
  width: 100%;
  height: 100%;
  .charts-content {
    width: 100%;
    height: 100%;
  }

  .image-wrapper {
    color: rgba(0, 0, 0, 0.45);
    display: flex;
    flex-direction: column;
    align-items: center;
    justify-content: center;
  }

  .no-list-img {
    margin-bottom: 10px;
    width: 63px;
    height: 40px;
    background-repeat: no-repeat;
    background-image: url("data:image/svg+xml;base64,PHN2ZyB3aWR0aD0iNjQiIGhlaWdodD0iNDEiIHhtbG5zPSJodHRwOi8vd3d3LnczLm9yZy8yMDAwL3N2ZyI+CiAgPGcgdHJhbnNmb3JtPSJ0cmFuc2xhdGUoMCAxKSIgZmlsbD0ibm9uZSIgZmlsbC1ydWxlPSJldmVub2RkIj4KICAgIDxlbGxpcHNlIGZpbGw9IiNGNUY1RjUiIGN4PSIzMiIgY3k9IjMzIiByeD0iMzIiIHJ5PSI3Ii8+CiAgICA8ZyBmaWxsLXJ1bGU9Im5vbnplcm8iIHN0cm9rZT0iI0Q5RDlEOSI+CiAgICAgIDxwYXRoIGQ9Ik01NSAxMi43Nkw0NC44NTQgMS4yNThDNDQuMzY3LjQ3NCA0My42NTYgMCA0Mi45MDcgMEgyMS4wOTNjLS43NDkgMC0xLjQ2LjQ3NC0xLjk0NyAxLjI1N0w5IDEyLjc2MVYyMmg0NnYtOS4yNHoiLz4KICAgICAgPHBhdGggZD0iTTQxLjYxMyAxNS45MzFjMC0xLjYwNS45OTQtMi45MyAyLjIyNy0yLjkzMUg1NXYxOC4xMzdDNTUgMzMuMjYgNTMuNjggMzUgNTIuMDUgMzVoLTQwLjFDMTAuMzIgMzUgOSAzMy4yNTkgOSAzMS4xMzdWMTNoMTEuMTZjMS4yMzMgMCAyLjIyNyAxLjMyMyAyLjIyNyAyLjkyOHYuMDIyYzAgMS42MDUgMS4wMDUgMi45MDEgMi4yMzcgMi45MDFoMTQuNzUyYzEuMjMyIDAgMi4yMzctMS4zMDggMi4yMzctMi45MTN2LS4wMDd6IiBmaWxsPSIjRkFGQUZBIi8+CiAgICA8L2c+CiAgPC9nPgo8L3N2Zz4K");
  }
}
</style>
引用echarts界面
    <div style="width: 500px; height: 300px">
      <echarts :visible="true" :option="option"></echarts>
    </div>

<script >
export default {
  components: {
    Echarts: defineAsyncComponent(() => import("@/components/echarts")),
  },
    setup() {
        const state = reactive({
      option: {
        title: {
          text: "World Population",
        },
        tooltip: {
          trigger: "axis",
          axisPointer: {
            type: "shadow",
          },
        },
        legend: {
          type:'plain'
        },
        grid: {
          left: "3%",
          right: "4%",
          bottom: "3%",
          containLabel: true,
        },
        xAxis: {
          type: "value",
          boundaryGap: [0, 0.01],
        },
        yAxis: {
          type: "category",
          data: ["Brazil", "Indonesia", "USA", "India", "China", "World"],
        },
        series: [
          {
            name: "2011",
            type: "bar",
            data: [18203, 23489, 29034, 104970, 131744, 630230],
          },
          {
            name: "2012",
            type: "bar",
            data: [19325, 23438, 31000, 121594, 134141, 681807],
          },
        ],
      },
    });
      return {
      ...toRefs(state)
      }
  }
}


 1617
1617

 被折叠的 条评论
为什么被折叠?
被折叠的 条评论
为什么被折叠?
 到【灌水乐园】发言


