


文章目录
快速打造简易实时监控系统
一、为什么要监控服务器数据
监控为什么会如此重要?
- 提前预防故障发生(磁盘、内存、CPU)
- 发生故障及时了解,并通过历史数据回溯故障
- 为数据统计提供依据(稳定性,故障率等)
云服务器=> 按使用时长收费,按月/年购买 - 节省出时间,让我们腾出精力做更有意义的事
二、准备工作
1. 获取网卡实时流量信息 - psutil
安装psutil
yum install python3-devel*
pip3 install psutil
获取网卡实时流量
以秒为单位获取网卡流量,输出
时间戳,网卡recv,网send
import psutil
import time


def get_net_speed(interval):
    '''
    输入间隔数,得到间隔数内网卡的流量
    :param interval: 间隔数
    :return:时间戳 间隔数内的发送字节 间隔数内的接收字节
    '''
    net_msg = psutil.net_io_counters()
    bytes_sent, bytes_recv = net_msg.bytes_sent, net_msg.bytes_recv
    time.sleep(interval)
    time1 = int(time.time())
    net_msg = psutil.net_io_counters()
    bytes_sent2, bytes_recv2 = net_msg.bytes_sent, net_msg.bytes_recv
    bytes_sent3 = bytes_sent2 - bytes_sent
    bytes_recv3 = bytes_recv2 - bytes_recv
	return time1,bytes_sent3,bytes_recv3

while 1:
        print(get_net_speed(1))
2.存储信息 - mysql (可用mariadb或者mysql)
安装和启动
#安装epel源
yum install epel-release -y
#查看与mariadb有关的已安装的包和需要安装的包
yum list mariadb*
# 安装mariadb
yum -y install mariadb*
# 启动mariadb
systemctl start mariadb
# 开机启动
systemctl enable mariadb
连接数据库,创建表
# 进入mysql服务端
# mysql

# 创建weblog数据库
> CREATE DATABASE weblog;
# 使用weblog数据库
> USE weblog;
# 查看数据表有哪一些
> show tables;
# 创建access表: access_time, region, ISP, num
> CREATE TABLE access (access_time char(19), regin char(10), ISP char(2),
num int);
python连接数据库
安装pymysql => python连接数据库的模块
pip3 install pymysql
连接数据库并入库
import pymysql
# 打开数据库连接
db = pymysql.connect(host='localhost',
                     user='root',
                     password='',
                     database='weblog')
# 自动提交数据
db.autocommit(True)
# 使用 cursor() 方法创建一个游标对象 cursor
cursor = db.cursor()

# 使用 execute() 方法执行 SQL 查询
cursor.execute("SELECT VERSION()")

# 使用 fetchone() 方法获取单条数据.
data = cursor.fetchone()
# 使用 fetchall() 方法获取所有数据.
#data = cursor.fetchall()

print ("Database version : %s " %data)
# 插入数据
cursor.execute("insert into access values('2022-10-10 15','湖南','电
信',100)")

# 关闭数据库连接
db.close()
练习:将所有的web日志都 插入到数据库中
import pymysql
# 打开数据库连接
db = pymysql.connect(host='localhost',
                     user='root',
                     password='',
                     database='weblog')
# 使用 cursor() 方法创建一个游标对象 cursor
cursor = db.cursor()
with open("filename.txt") as fp:
   for line in fp:
       datas = line.split(',')
       sql = f"insert into access
values('{datas[0]}','{datas[1]}', '{datas[2]}', {datas[3]})"
       cursor.execute(sql)
db.commit()
三、数据展示
1.创建数据库表
> CREATE DATABASE monitor;
> USE monitor;
> CREATE TABLE nic (time int, nic_in float, nic_out float);
2.获取网卡流量并入库
[root@mysql monitor]# cat get_nic.py
#!/bin/python3
import pymysql
import psutil
import time

db = pymysql.connect(host='localhost',
                    user='root',
		    password='',
		    database='monitor')
db.autocommit(True)

cursor=db.cursor()
def get_net_speed(interval):
    '''
    输入间隔数,得到间隔数内网卡的流量
    :param interval: 间隔数
    :return:时间戳 间隔数内的发送字节 间隔数内的接收字节
    '''
    net_msg = psutil.net_io_counters()
    bytes_sent, bytes_recv = net_msg.bytes_sent, net_msg.bytes_recv
    time.sleep(interval)
    time1 = int(time.time())
    net_msg = psutil.net_io_counters()
    bytes_sent2, bytes_recv2 = net_msg.bytes_sent, net_msg.bytes_recv
    bytes_sent3 = bytes_sent2 - bytes_sent
    bytes_recv3 = bytes_recv2 - bytes_recv
    sql=f"insert into nic values('{time1}','{bytes_sent3}','{bytes_recv3}')"
    cursor.execute(sql)

while 1:
        get_net_speed(1)
3.web显示
# pip3 install flask
web渲染界面(简单文字)
from flask import Flask
# 创建一个服务
app = Flask(__name__)
# 创建一条路由
@app.route('/')

def index():
   return "hello"

if __name__ == "__main__":
   app.run(host="0.0.0.0", port=8000 , debug=True)


# host="0.0.0.0" => 监听地址 => 从哪个ip上进行访问
#                 => 0.0.0.0 可以从本机所有的ip进行访问
# port=8000       => 监听端口
图表展示(模板数据)
[root@mysql monitor]# cat web.py
from flask import Flask,render_template

# 创建一个服务
app = Flask(__name__)

# 创建一条路由(路径)
@app.route('/')
def index():
    #return "Hello"
    return render_template('index.html')
# 运行服务
app.run(host="0.0.0.0", port=8000,debug=True)
templates/index.html
https://www.hcharts.cn/demo/highstock/dynamic-update
<!DOCTYPE HTML>
<html>
   <head>
       <meta charset="utf-8"><link rel="icon"
href="https://jscdn.com.cn/highcharts/images/favicon.ico">
       <meta name="viewport" content="width=device-width, initial-scale=1">
       <style>
           /* css 代码 */
       </style>
       <script src="https://code.highcharts.com.cn/jquery/jquery1.8.3.min.js"></script>

      <script src="https://cdn.highcharts.com.cn/highstock/highstock.js">
</script>
       <script
src="https://cdn.highcharts.com.cn/highcharts/modules/exporting.js">
</script>
       <script src="https://code.highcharts.com.cn/highchartsplugins/highcharts-zh_CN.js"></script>

  </head>
   <body>
       <div id="container" style="min-width:400px;height:400px"></div>
       <script>
           // JS 代码
           Highcharts.setOptions({
 global : {
 useUTC : false
 }
});
// Create the chart
Highcharts.stockChart('container', {
 chart : {
 events : {
 load : function () {
  // set up the updating of the chart each
second
 var series = this.series[0];
 setInterval(function () {
 var x = (new Date()).getTime(), //
current time
 y = Math.round(Math.random()
* 100);
 series.addPoint([x, y], true, true);
 }, 1000);
 }
 }
 },
 rangeSelector: {
 buttons: [{
 count: 1,
 type: 'minute',
 text: '1M'
 }, {
 count: 5,
 type: 'minute',
 text: '5M'
 }, {
 type: 'all',
 text: 'All'
 }],
 inputEnabled: false,
 selected: 0
 },
 title : {
 text : 'Live random data'
 },
 tooltip: {
 split: false
 },
 exporting: {
 enabled: false
 },
 series : [{
 name : '随机数据',
 data : (function () {
 // generate an array of random data
 var data = [], time = (new Date()).getTime(), i;
 for (i = -999; i <= 0; i += 1) {
 data.push([
 time + i * 1000,
 Math.round(Math.random() * 100)
 ]);
 }
 return data;
 }())
 }]
});
       </script>
   </body>
</html>
真实数据接口
[root@mysql monitor]# ls
flask_web.py  get_nic.py  templates  web.py
[root@mysql monitor]# cat flask_web.py
#!/bin/python3
from flask import Flask, render_template
import json
import pymysql as mysqldb

app = Flask(__name__)
db = mysqldb.connect(user="root", passwd="", db="monitor", host="localhost")
db.autocommit(True)
cur = db.cursor()


@app.route('/')
def index():
    # return "hello cici"
    return render_template("index.html")

t_time = 0
@app.route('/data')
def data():
    global t_time
    if t_time >0:
        sql = "select time, nic_in from nic where time > {t_time}".format(t_time = t_time)
    else:
        sql = "select * from (select time, nic_in from nic order by time desc limit 100000) t order by time;"
    cur.execute(sql)
    ret = []
    for item in cur.fetchall():
        ret.append([int(item[0])*1000, item[1]])
    if len(ret)>0:
        t_time = ret[-1][0]/1000
    return json.dumps(ret)

if __name__ == "__main__":
    app.run(host="0.0.0.0", port=80 , debug=True)
动态图 => 第一次一次性加载所有的数据,后面会动态获取更新的数据
接口1 => 获取一次数据
接口2 => 动态获取更新的数据
html加载自己的数据
[root@mysql monitor]# cd templates/
[root@mysql templates]# ls
index.html
[root@mysql templates]# cat index.html
<div id="container" style="min-width:400px;height:400px"></div>
<script src="https://img.hcharts.cn/jquery/jquery-1.8.3.min.js"></script>
<script src="https://img.hcharts.cn/highstock/highstock.js"></script>
<script src="https://img.hcharts.cn/highcharts/modules/exporting.js"></script>
<script src="https://img.hcharts.cn/highcharts-plugins/highcharts-zh_CN.js"></script>
<script>
$(function () {
Highcharts.setOptions({
global : {
useUTC : false
}
});
// Create the chart
$('#container').highcharts('StockChart', {
chart : {
events : {
load : function () {
// set up the updating of the chart each second
var series = this.series[0];
setInterval(function () {
$.getJSON('/data',function(ret){
$.each(ret, function(item, value){
series.addPoint(value)
})
})
}, 1000);
}
}
},
rangeSelector: {
buttons: [{
count: 1,
type: 'minute',
text: '1M'
}, {
count: 5,
type: 'minute',
text: '5M'
}, {
type: 'all',
text: 'All'
}],
inputEnabled: false,
selected: 0
},
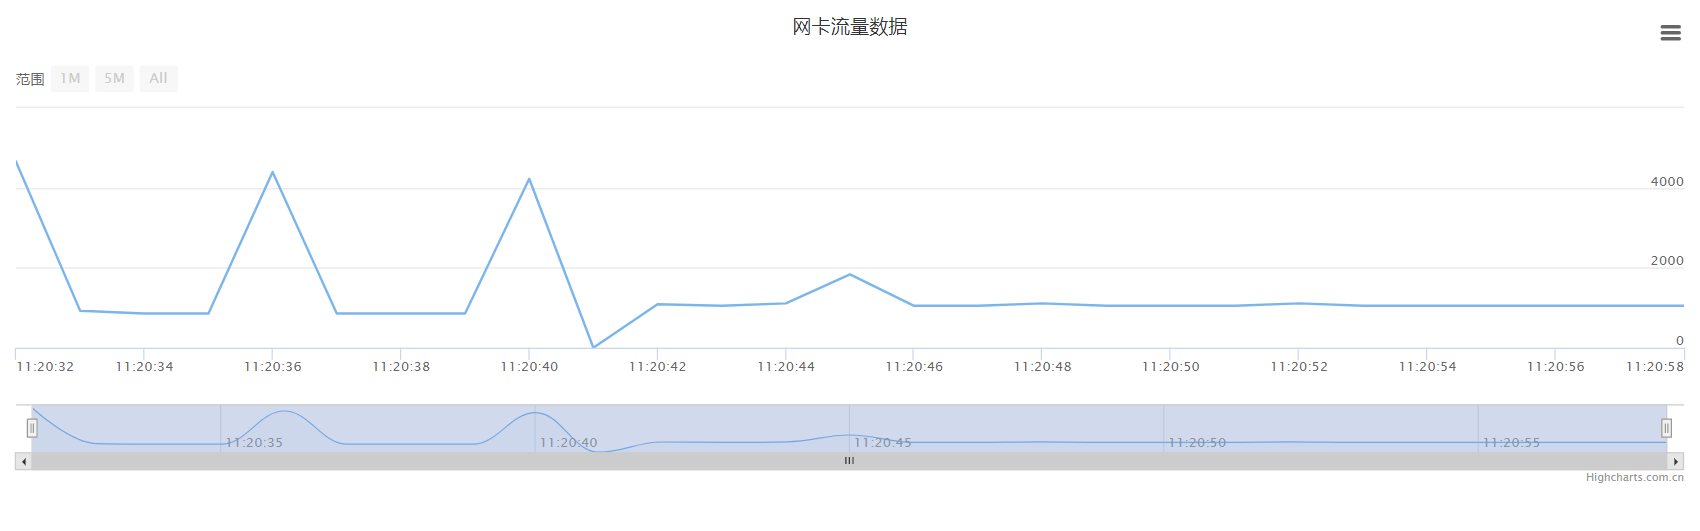
title : {
text : '网卡流量数据'
},
exporting: {
enabled: true
},
series : [{
name : 'recv流量',
data : (function () {
$.ajaxSettings.async = false
data = []
$.getJSON('/data', function(ret){
data = ret
})
return data;
}())
}]
});
});
</script>
4.运行三个脚本,根据提示的ip和端口信息访问页面看效果
[root@mysql monitor]# ls
flask_web.py  get_nic.py  templates  web.py

python3 get_nic.py
python3 web.py
python3 flask_web.py
5.遇到的问题
浏览器打开网页打不开
=> ip是否通 => ping …
=> 防火墙 => 关
=> 服务是否正常 => netstate -anplut |grep 8000


 348
348


 被折叠的 条评论
为什么被折叠?
被折叠的 条评论
为什么被折叠?
 到【灌水乐园】发言


