


序
为了节省后续开发学习成本,这个系列将记录我工作所用到的一些echarts图表。
示例
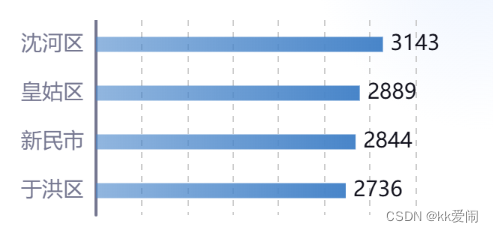
水平柱状图如图所示:
数据格式
data = [
    {
      'name': '于洪区',
      'value': 2736
    },
    {
      'name': '新民市',
      'value': 2844
    },
    {
      'name': '皇姑区',
      'value': 2889
    },
    {
      'name': '沈河区',
      'value': 3143
    }
  ]
代码
Vue版本以及脚本语言的选择各有不同,核心内容主要是option,重点关注该部分内容即可。
<template>
  <div class="chart" ref="horizontalBarRef"></div>
</template>

<script lang="ts">
import { Component, Prop, Ref, Vue, Watch } from 'vue-property-decorator'
import echarts from 'echarts'

@Component({
  name: 'HorizontalBar',
  components: {}
})
export default class HorizontalBar extends Vue {
  @Prop() data!: any
  @Prop({ default: () => ['rgba(72, 133, 201, 0.6)', 'rgba(72, 133, 201, 1)']}) colors?: any[]
  @Ref() horizontalBarRef!: any

  //此处监听是为了在有状态切换时,例如时间年份或其他条件改变时,能够让Echarts图表重新渲染
  @Watch('data')
  onDataChange() {
    this.createHorizontalBarChart()
  }

  private chart: any = {}

  createHorizontalBarChart() {
    this.chart = echarts.init(this.horizontalBarRef)
    const data = this.data
    let names = []
    let values = []
    data.forEach(item => {
      names.push(item.name)
      values.push(item.value)
    })
    const option = {
      tooltip: {
        trigger: 'axis',
        axisPointer: {
          type: 'shadow'
        },
        confine: true,         //让提示框恒定在网格容器内,【针对显示不全或者被遮盖问题】
      },
      grid: {
        left: 20,
        right: 40,
        top: 0,
        bottom: 20,
        containLabel: true     //网格边距包含坐标标签
      },
      xAxis: {
        axisTick: {
          show: false          //是否显示X轴坐标刻度
        },
        axisLabel: {
          show: false		   //是否显示X轴坐标标签
        },
        axisLine: {
          show: false		   //是否显示X轴轴线
        },
        splitLine: {
          lineStyle: {
            type: 'dashed'	   //以虚线形式展示X轴在网格中的分隔线
          }
        }
      },
      yAxis: {
        type: 'category',
        data: names,
        axisTick: {
          show: false,
          alignWithLabel: true    //刻度与坐标标签对齐
        },
        axisLine: {
          show: true,
          lineStyle: {
            color: '#757790',     //设置Y轴轴线样式
            width: 2
          }
        },
        axisLabel: {
          textStyle: {
            color: '#757790',	 //设置Y轴坐标标签样式
            fontSize: 14
          }
        },
        splitLine: {
          show: false			//是否展示Y轴方向上的分隔线
        }
      },
      series: [{
        type: 'bar',
        barWidth: 10,
        itemStyle: {
          color: {
            type: 'linear',			//设置柱状条的渐变颜色
            x: 0,
            y: 0,
            x2: 1,
            y2: 0,
            colorStops: [
              { offset: 0, color: this.colors[0] }, // 0% 处的颜色
              { offset: 1, color: this.colors[1] } // 100% 处的颜色
            ],
            global: false // 缺省为 false
          }
        },
        label: {
          show: true,				//展示柱状条数值信息
          position: 'right',
          color: '#12121D',
          fontSize: 14
        },
        data: values
      }]
    }
    this.chart.setOption(option)
  }

  mounted() {
    this.createHorizontalBarChart()
    window.addEventListener('resize', this.chartResize)
  }

  beforeDestroy() {
    if (this.chart) {
      window.removeEventListener('resize', this.chartResize)
      this.chart.dispose()
    }
  }

  chartResize() {
    if (this.chart) {
      this.chart.resize()
    }
  }
}
</script>
<style lang="scss" scoped>
.chart {
  width: 100%;
  height: 300px;
}
</style>


 3216
3216

 被折叠的 条评论
为什么被折叠?
被折叠的 条评论
为什么被折叠?
 到【灌水乐园】发言


