


序
为了节省后续开发学习成本,这个系列将记录我工作所用到的一些echarts图表。
前提说明
因为饼图中间需要添加图片,所以比较特殊,对于饼图中间数据的对齐很容易出现问题,大家参考时以具体要求进行修改。【本人对于对齐的处理过于简单粗暴,大家有更好的办法可以加以指正】
同时,因Echarts使用版本不同,有些参数可以省略,而有些效果可能也没法呈现,当前示例是基于4.8.0版本的,当前最新版本还可以实现中间图片360°循环旋转的效果。
示例
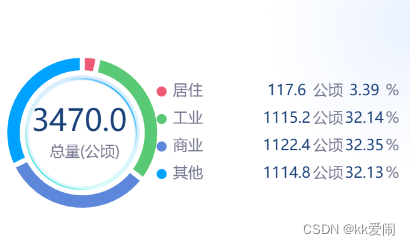
带图片的饼图如图所示:
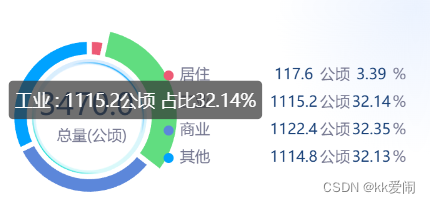
关于代码中:tooltip的内容{b} : {c}公顷 占比{d}%
数据格式
data = [
    {
      value: 117.6,
      name: '居住'
    },
    {
      value: 1115.2,
      name: '工业'
    },
    {
      value: 1122.4,
      name: '商业'
    },
    {
      value: 1114.8,
      name: '其他'
    }
  ]
代码
Vue版本以及脚本语言的选择各有不同,核心内容主要是option,重点关注该部分内容即可。
<template>
  <div class="chart" ref="graphicPieRef"></div>
</template>

<script lang="ts">
import { Component, Prop, Ref, Vue, Watch } from 'vue-property-decorator'
import echarts from 'echarts'

@Component({
  name: 'GraphicPie',
  components: {}
})
export default class GraphicPie extends Vue {
  @Prop() data!: any
  @Ref() graphicPieRef!: any
  private chart: any = {}

  @Watch('data')
  onDataChange() {
    this.createChart()
  }

  lefts = ['18%', '15.5%', '13.5%', '11.5%', '9.5%', '7.5%', '5.5%', '3.5%', '1.5%']

  createChart() {
    this.chart = echarts.init(this.graphicPieRef)

    //添加在饼图中的图片
    const img = require('@/assets/img/cockpit/center-pie.png')
    const data = this.data

    //计算数据的总值
    let total = this.data.reduce((acc: number, cur: any) => {
      return acc + cur.value
    }, 0)
    total = total.toFixed(1)

    //此处是为了获取总数相应位数应该对齐的位置
    let left = this.lefts[total.toString().length - 1]
    const option = {
      tooltip: {
        trigger: 'item',
        formatter: '{b} : {c}公顷 占比{d}%',
        confine: true
      },
      legend: {
        icon: 'circle',
        orient: 'vertical',
        right: 0,
        top: 'center',
        itemGap: 10,
        itemWidth: 8,
        itemHeight: 8,
        formatter: function(name: string) {
          let target: number = 0
          let percent: any

          // 计算对应图例数据的所占百分比
          for (let i = 0; i < data.length; i++) {
            if (data[i].name === name) {
              target = Number(data[i].value)
              if (target === 0) {
                percent = 0
              } else {
                percent = (target / total * 100).toFixed(2)
              }
            }
          }

          let formattedName = ''

          //当图例文字过于长时,可以选择添加换行符
          for (let i = 0; i < name.length; i += 6) {
            formattedName += name.substring(i, i + 6) + '\n'
          }
          if (formattedName.endsWith('\n')) {
            formattedName = formattedName.slice(0, -1)
          }

          var arr = [
            '{name|' + formattedName + '}',
            '{value|' + target + '}',
            '{unit|公顷}',
            '{value1|' + percent + '}',
            '{unit|%}'
          ]
          return arr.join(' ')
        },
        textStyle: {      //使用rich格式化图例数据的展示
          rich: {
            name: {
              width: 70,
              color: '#757790'
            },
            value: {
              width: 35,
              color: '#194178',
              align: 'center'
            },
            value1: {
              width: 27,
              color: '#194178',
              align: 'center'
            },
            unit: {
              color: '#757790'
            }
          }
        }
      },
      graphic: [
        {
          type: 'image',   //添加图片
          style: {         //设置图片样式
            image: img,
            width: 95,
            height: 95
          },
          left: '5%',      //设置图片位置
          top: 'center'
        },
        {
          type: 'text',    //设置圆环中的总数位置上的样式
          left: left,
          top: '40%',
          style: {
            text: total,
            textAlign: 'center',
            fill: '#194178',
            fontSize: 24,
            fontWeight: 400
          }
        },
        {
          type: 'text',   //设置圆环中的单位位置上的样式
          left: '12%',
          top: '55%',
          style: {
            text: '总量(公顷)',
            textAlign: 'center',
            fill: '#757790',
            fontSize: 12,
            fontWeight: 400
          }
        }
      ],
      color: [
        '#ED5A75',
        '#59C975',
        '#5C87DA',
        '#00A2FF',
        '#B6D7E9',
        '#F9D03F',
        '#E3A256'
      ],
      series: [
        {
          type: 'pie',
          radius: ['48%', '62%'],  //设置两个圆环的大小
          center: ['20%', '50%'],  //设置饼图在网格容器中的位置
          data: data,
          // 间隔
          itemStyle: {
            normal: {
              borderWidth: 4,
              borderColor: '#fff'
            }
          },
          label: {  //是否显示饼图数据
            show: false
          },
          labelLine: {  //是否显示引导线
            show: false
          }
        }
      ]
    }
    this.chart.setOption(option)
  }

  mounted() {
    this.createChart()
    window.addEventListener('resize', this.chartResize)
  }

  beforeDestroy() {
    if (this.chart) {
      window.removeEventListener('resize', this.chartResize)
      this.chart.dispose()
    }
  }

  chartResize() {
    if (this.chart) {
      this.chart.resize()
    }
  }
}
</script>
<style lang="scss" scoped>
.chart {
  width: 100%;
  height: 400px;
}
</style>
动态旋转图片
如果需要实现图片的动态旋转效果的话,可以在graphic中type属性为image的项中添加如下内容:
keyframeAnimation: [
     {
         duration: 200000,       //设置间隔时间
         loop: true,             //是否开启循环
         keyframes: [            //动画效果
             {
                 percent: 0,
                 rotation: 0
             },
             {
                 percent: 1,
                 rotation: -360
             }
         ]
     }
 ]


 1700
1700

 被折叠的 条评论
为什么被折叠?
被折叠的 条评论
为什么被折叠?
 到【灌水乐园】发言


