


引言
本次博客将分享Udacity无人驾驶纳米学位的另一个项目,交通标志的识别。 本次项目实现主要采用CNN卷积神经网络,具体的网络结构参考Lecun提出的LeNet结构。参考文献:Lecun Paper
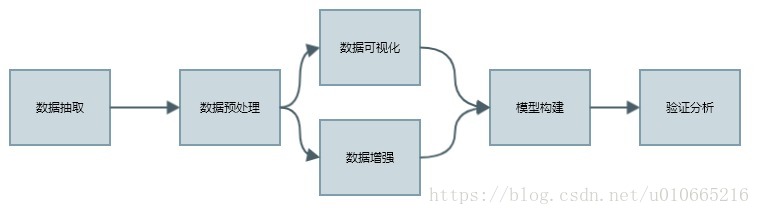
项目流程图
本项目的实现流程如下所示:
代码实现及解释
接下来我们就按照项目流程图来逐块实现,本项目数据集:German data 如果打不开,则有备用链接:备用![]() http://benchmark.ini.rub.de/?section=gtsrb&subsection=dataset
http://benchmark.ini.rub.de/?section=gtsrb&subsection=dataset
#import important packages/libraries
import numpy as np
import tensorflow as tf
import pickle
import matplotlib.pyplot as plt
import random
import csv
from sklearn.utils import shuffle
from tensorflow.contrib.layers import flatten
from skimage import transform as transf
from sklearn.model_selection import train_test_split
import cv2
from prettytable import PrettyTable
%matplotlib inline
SEED = 2018
/home/ora/anaconda3/envs/tensorflow/lib/python3.6/site-packages/h5py/__init__.py:36: FutureWarning: Conversion of the second argument of issubdtype from `float` to `np.floating` is deprecated. In future, it will be treated as `np.float64 == np.dtype(float).type`.
  from ._conv import register_converters as _register_converters
WARNING:tensorflow:From /home/ora/anaconda3/envs/tensorflow/lib/python3.6/site-packages/tensorflow/contrib/learn/python/learn/datasets/base.py:198: retry (from tensorflow.contrib.learn.python.learn.datasets.base) is deprecated and will be removed in a future version.
Instructions for updating:
Use the retry module or similar alternatives.
# 导入数据并可视化 training_file = 'data/train.p' testing_file = 'data/test.p' with open(training_file,mode='rb') as f: train = pickle.load(f) with open(testing_file,mode='rb') as f: test = pickle.load(f) X_train,y_train = train['features'],train['labels'] X_test,y_test = test['features'],test['labels']
Dataset Summary and Expoloration
下面我们对德国交通指示牌数据集进行可视化处理
n_train = len(X_train)
n_test = len(X_test)
_,IMG_HEIGHT,IMG_WIDTH,IMG_DEPTH = X_train.shape
image_shape = (IMG_HEIGHT,IMG_WIDTH,IMG_DEPTH)
with open('data/signnames.csv','r') as sign_name:
reader = csv.reader(sign_name)
sign_names = list(reader)
sign_names = sign_names[1::]
NUM_CLASSES = len(sign_names)
print('Total number of classes:{}'.format(NUM_CLASSES))
n_classes = len(np.unique(y_train))
assert (NUM_CLASSES== n_classes) ,'1 or more class(es) not represented in training set'
n_test = len(y_test)
print('Number of training examples =',n_train)
print('Number of testing examples =',n_test)
print('Image data shape=',image_shape)
print('Number of classes =',n_classes)
Total number of classes:43
Number of training examples = 34799
Number of testing examples = 12630
Image data shape= (32, 32, 3)
Number of classes = 43
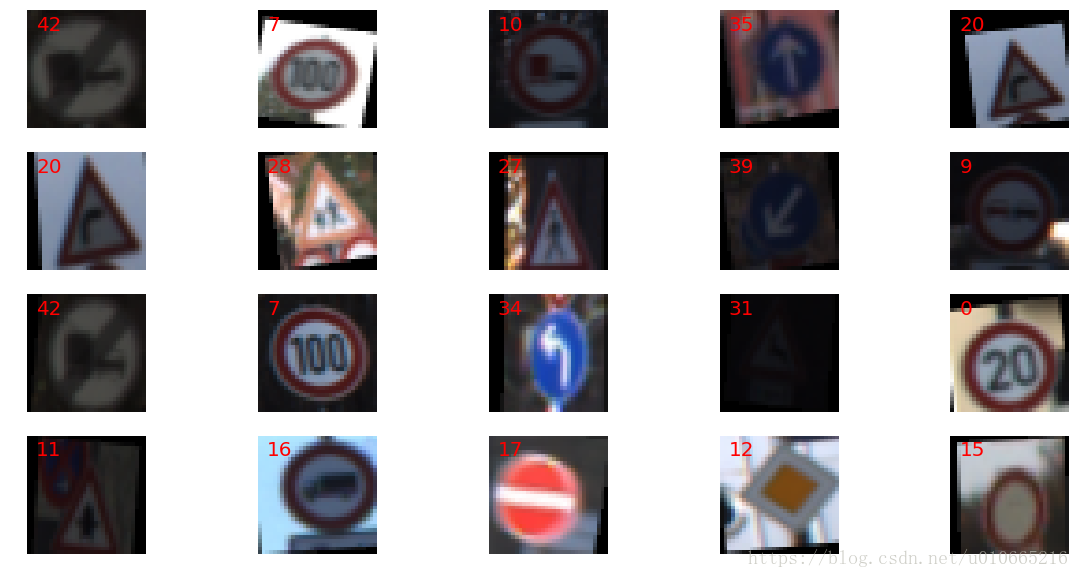
#data visualization,show 20 images
def visualize_random_images(list_imgs,X_dataset,y_dataset):
    #list_imgs:20 index
    _,ax = plt.subplots(len(list_imgs)//5,5,figsize=(20,10))
    row,col = 0,0
    for idx in list_imgs:
        img = X_dataset[idx]
        ax[row,col].imshow(img)
        ax[row,col].annotate(int(y_dataset[idx]),xy=(2,5),color='red',fontsize='20')
        ax[row,col].axis('off')
        col+=1
        if col==5:
            row,col = row+1,0
    plt.show()
ls = [random.randint(0,len(y_train)) for i in range(20)]
visualize_random_images(ls,X_train,y_train)
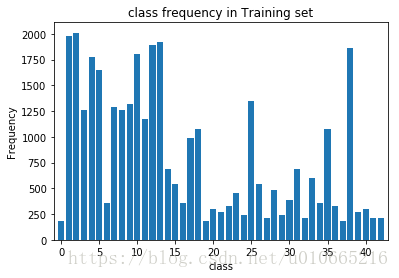
def get_count_imgs_per_class(y, verbose=False):
num_classes = len(np.unique(y))
count_imgs_per_class = np.zeros( num_classes )
for this_class in range( num_classes ):
if verbose:
print('class {} | count {}'.format(this_class, np.sum( y == this_class )) )
count_imgs_per_class[this_class] = np.sum(y == this_class )
#sanity check
return count_imgs_per_class
class_freq = get_count_imgs_per_class(y_train)
print('------- ')
print('Highest count: {} (class {})'.format(np.max(class_freq), np.argmax(class_freq)))
print('Lowest count: {} (class {})'.format(np.min(class_freq), np.argmin(class_freq)))
print('------- ')
plt.bar(np.arange(NUM_CLASSES), class_freq , align='center')
plt.xlabel('class')
plt.ylabel('Frequency')
plt.xlim([-1, 43])
plt.title("class frequency in Training set")
plt.show()
sign_name_table = PrettyTable()
sign_name_table.field_names = ['class value', 'Name of Traffic sign']
for i in range(len(sign_names)):
sign_name_table.add_row([sign_names[i][0], sign_names[i][1]] )
print(sign_name_table)
-------
Highest count: 2010.0 (class 2)
Lowest count: 180.0 (class 0)
-------
+-------------+----------------------------------------------------+
| class value |                Name of Traffic sign                |
+-------------+----------------------------------------------------+
|      0      |                Speed limit (20km/h)                |
|      1      |                Speed limit (30km/h)                |
|      2      |                Speed limit (50km/h)                |
|      3      |                Speed limit (60km/h)                |
|      4      |                Speed limit (70km/h)                |
|      5      |                Speed limit (80km/h)                |
|      6      |            End of speed limit (80km/h)             |
|      7      |               Speed limit (100km/h)                |
|      8      |               Speed limit (120km/h)                |
|      9      |                     No passing                     |
|      10     |    No passing for vechiles over 3.5 metric tons    |
|      11     |       Right-of-way at the next intersection        |
|      12     |                   Priority road                    |
|      13     |                       Yield                        |
|      14     |                        Stop                        |
|      15     |                    No vechiles                     |
|      16     |      Vechiles over 3.5 metric tons prohibited      |
|      17     |                      No entry                      |
|      18     |                  General caution                   |
|      19     |            Dangerous curve to the left             |
|      20     |            Dangerous curve to the right            |
|      21     |                    Double curve                    |
|      22     |                     Bumpy road                     |
|      23     |                   Slippery road                    |
|      24     |             Road narrows on the right              |
|      25     |                     Road work                      |
|      26     |                  Traffic signals                   |
|      27     |                    Pedestrians                     |
|      28     |                 Children crossing                  |
|      29     |                 Bicycles crossing                  |
|      30     |                 Beware of ice/snow                 |
|      31     |               Wild animals crossing                |
|      32     |        End of all speed and passing limits         |
|      33     |                  Turn right ahead                  |
|      34     |                  Turn left ahead                   |
|      35     |                     Ahead only                     |
|      36     |                Go straight or right                |
|      37     |                Go straight or left                 |
|      38     |                     Keep right                     |
|      39     |                     Keep left                      |
|      40     |                Roundabout mandatory                |
|      41     |                 End of no passing                  |
|      42     | End of no passing by vechiles over 3.5 metric tons |
+-------------+----------------------------------------------------+
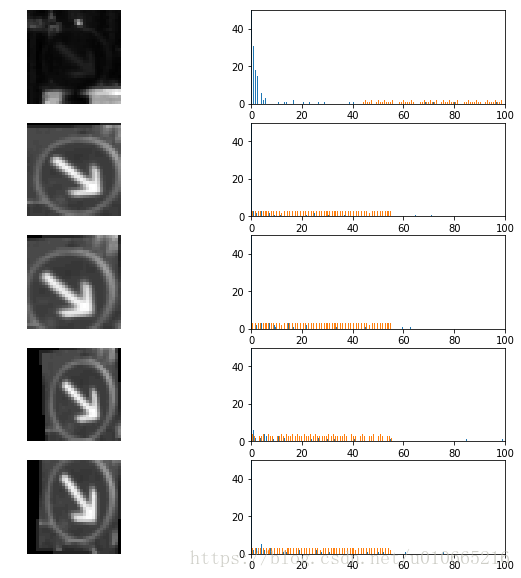
def histograms_randImgs(label,channel,n_imgs=5,ylim=50):
    '''
    Histogram (pixel intensity distribution) for a selection of images with the same label.
    For better visualization, the images are shown in grayscale
    label - the label of the images
    n_imgs - number of images to show (default=5)
    channel - channel used to compute histogram
    ylim - range of y axis values for histogram plot (default=50)
    '''
    assert channel < 3,'image are RGB,choose channel value between in the range[0,2]'
    assert (np.sum(y_train==label))>=n_imgs,'reduce your number of images'

    all_imgs = np.ravel(np.argwhere(y_train==label))

    #随机选择5张图片
    ls_idx = np.random.choice(all_imgs,size=n_imgs,replace=False)
    _,ax = plt.subplots(n_imgs,2,figsize=(10,10))
    print('Histogram of selected images from the class{} ......'.format(label))
    row,col = 0,0
    for idx in ls_idx:
        img = X_train[idx,:,:,channel]
        #print(img.shape)
        ax[row,col].imshow(img,cmap='gray')
        ax[row,col].axis('off')

        hist = np.histogram(img,bins=256)
        ax[row,col+1].hist(hist,bins=256)
        ax[row,col+1].set_xlim([0,100])
        ax[row,col+1].set_ylim([0,ylim])
        col,row = 0,row+1
    plt.show()
histograms_randImgs(38,1)
Histogram of selected images from the class38 ......
接下来对数据做进一步处理
我们完成以下几个步骤:
数据增强
将RGB转换成Grayscale
数据尺度变换
Note:数据集的划分必须在数据增强完成前(防止验证集被合成图像污染)
数据增强具体步骤
这里的数据增强主要是:1.增加训练集的大小 2.调整了类别分布(类别分布是不均衡的,因为测试集可能相较与训练集来讲,有着不同的分布,因此我们希望在类别分布均衡的数据集上训练,给不同类别相同的权重,然后在不均衡的数据集上测试时可以有更好的效果) 数据增强后,我们得到每个类别4000张图片 数据增强的方法主要就是从原始数据集中随机选取图片,并应用仿射变换
旋转角度我限制在【-10,10】度之间,如果旋转角度过大,有些交通标志的意思可能就会发生变化了
水平、垂直移动的话,范围限制在【-3,3】px之间
伸缩变换限制在【0.8,1.2】
def random_transform(img,angle_range=[-10,10],
                    scale_range=[0.8,1.2],
                    translation_range=[-3,3]):
    '''
    The function takes an image and performs a set of random affine transformation.
    img:original images
    ang_range:angular range of the rotation [-15,+15] deg for example
    scale_range: [0.8,1.2]
    shear_range:[10,-10]
    translation_range:[-2,2]
    '''
    img_height,img_width,img_depth = img.shape
    # Generate random parameter values
    angle_value = np.random.uniform(low=angle_range[0],high=angle_range[1],size=None)
    scaleX = np.random.uniform(low=scale_range[0],high=scale_range[1],size=None)
    scaleY = np.random.uniform(low=scale_range[0],high=scale_range[1],size=None)
    translationX = np.random.randint(low=translation_range[0],high=translation_range[1]+1,size=None)
    translationY = np.random.randint(low=translation_range[0],high=translation_range[1]+1,size=None)

    center_shift = np.array([img_height,img_width])/2. - 0.5
    transform_center = transf.SimilarityTransform(translation=-center_shift)
    transform_uncenter = transf.SimilarityTransform(translation=center_shift)

    transform_aug = transf.AffineTransform(rotation=np.deg2rad(angle_value),
                                          scale=(1/scaleY,1/scaleX),
                                          translation = (translationY,translationX))
    #Image transformation : includes rotation ,shear,translation,zoom
    full_tranform = transform_center + transform_aug + transform_uncenter
    new_img = transf.warp(img,full_tranform,preserve_range=True)

    return new_img.astype('uint8')

def data_augmentation(X_dataset,y_dataset,augm_nbr,keep_dist=True):
    '''
    X_dataset:image dataset to augment
    y_dataset:label dataset
    keep_dist - True:keep class distributio
 最低0.47元/天 解锁文章


 4024
4024


 被折叠的 条评论
为什么被折叠?
被折叠的 条评论
为什么被折叠?
 到【灌水乐园】发言


