


2023.5.20日发布
最近有需求绘制如下这种密度图:
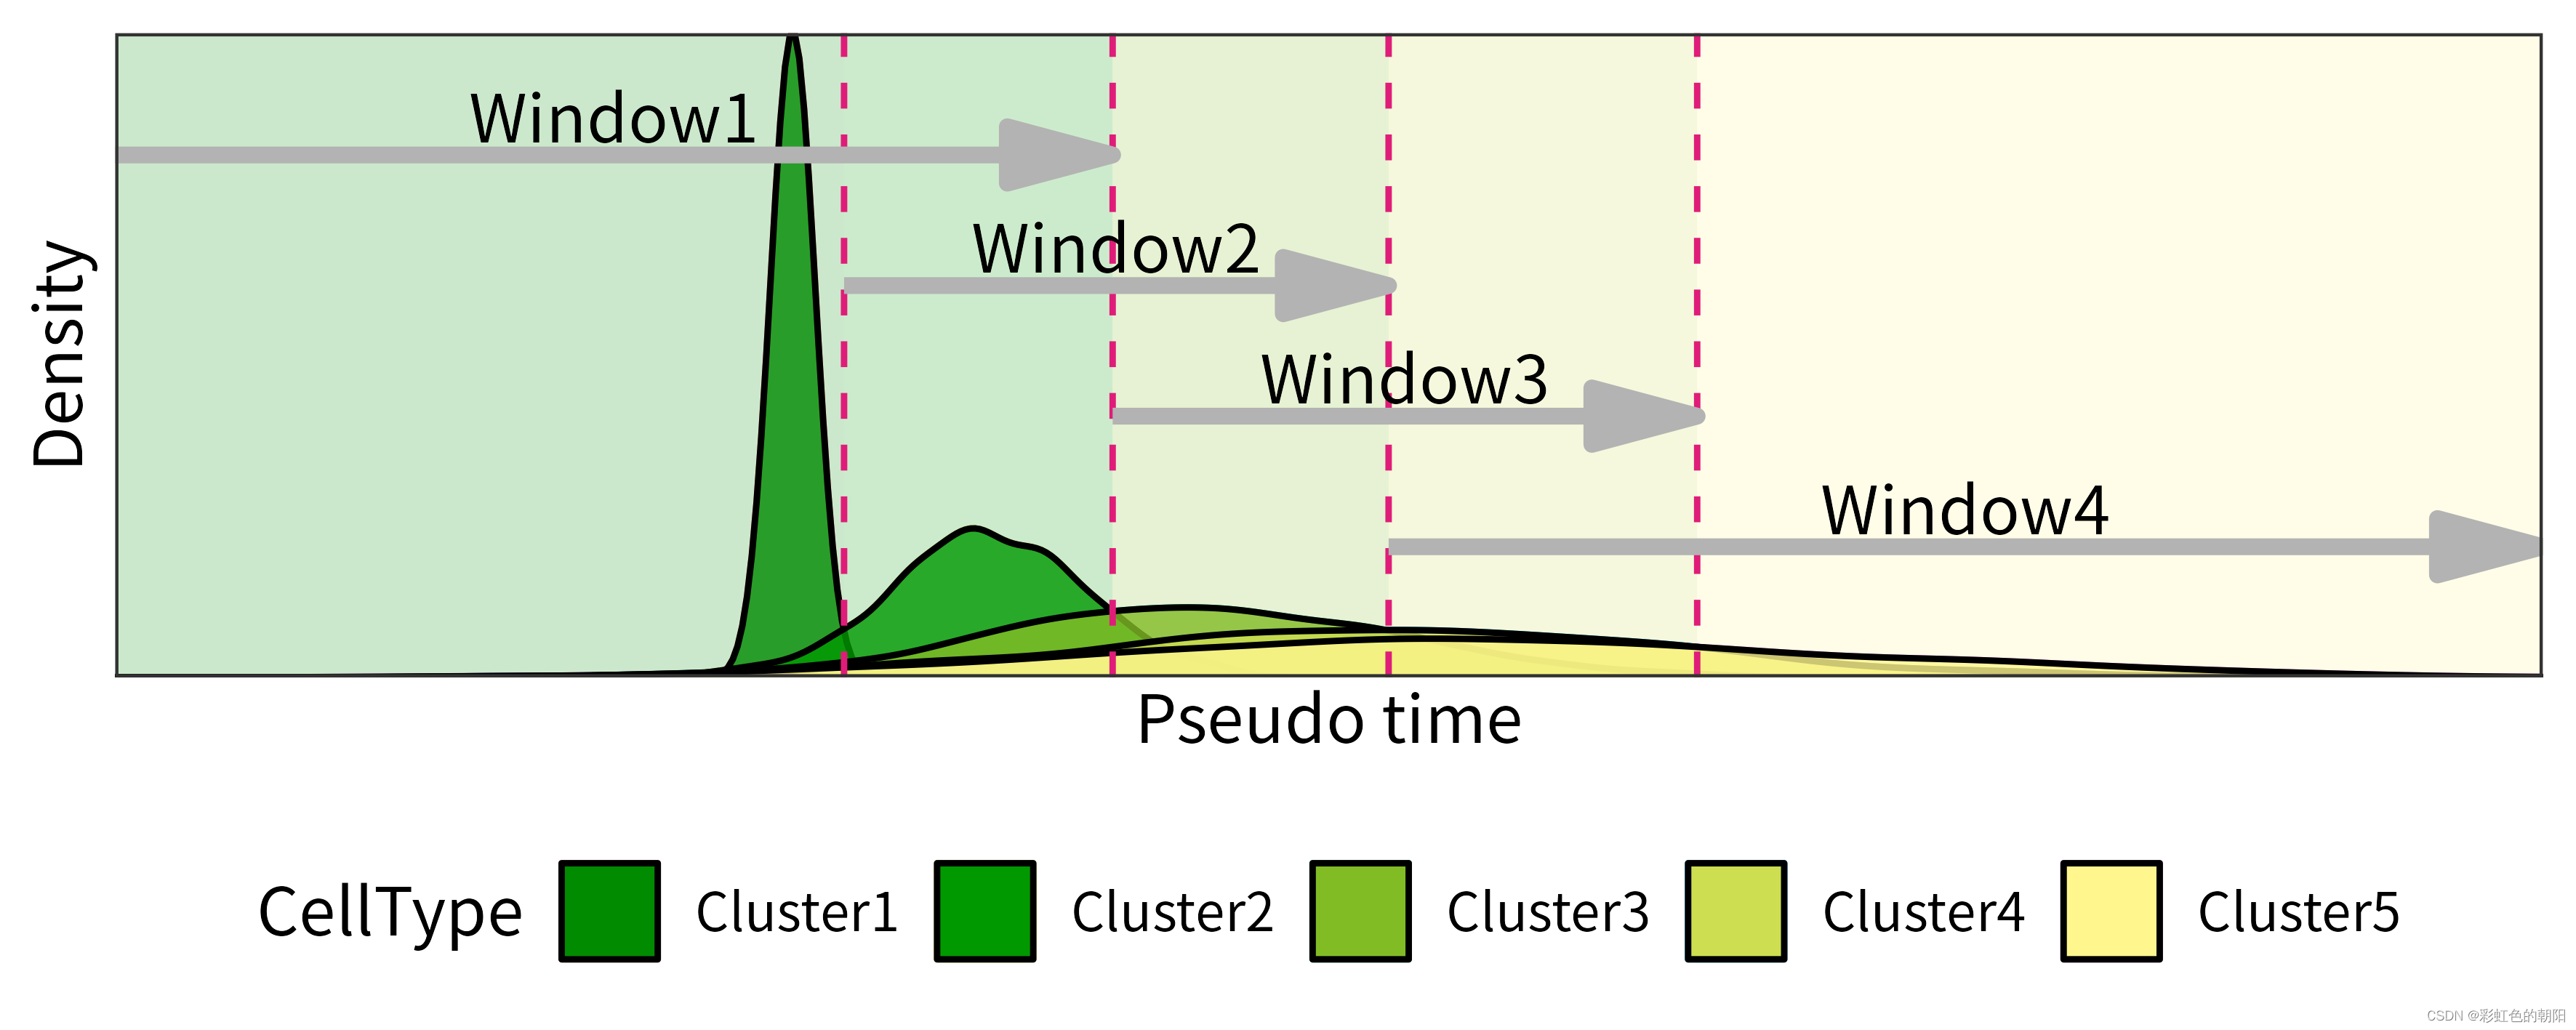
经过查找资料没有发现很好的解决办法,在这里给出一个使用ggplot2绘制该图的方法,代码如下:
#' density.intersection
#'
#' @param metaData
#' @param clusterLists
#' @param fileSave
#' @param plot
#' @param colorSets
#'
#' @return
#' @export
#'
#' @examples
#' testData <- rbind(data.frame(Cluster = "Cluster1", Pseudotime = rnorm(1000, mean = 0, sd = 0)),
#'                   data.frame(Cluster = "Cluster2", Pseudotime = rnorm(1000, mean = 2, sd = 1)),
#'                   data.frame(Cluster = "Cluster3", Pseudotime = rnorm(1000, mean = 4, sd = 2)),
#'                   data.frame(Cluster = "Cluster4", Pseudotime = rnorm(1000, mean = 6, sd = 3)),
#'                   data.frame(Cluster = "Cluster5", Pseudotime = rnorm(1000, mean = 7, sd = 4)))
#' testLists <- list(c("Cluster1", "Cluster2"), c("Cluster2", "Cluster3"), c("Cluster3", "Cluster4"), c("Cluster4", "Cluster5"))
#' density.intersection(metaData = testData, clusterLists = testLists, plot = TRUE, fileSave = "test.png")
#'
density.intersection <- function(metaData = NULL,
                                 clusterLists = NULL,
                                 plot = FALSE,
                                 fileSave = NULL,
                                 colorSets = NULL) {
  if (is.null(metaData)) stop("Error......")
  metaData <- metaData[, c("Cluster", "Pseudotime")]

  if (is.null(clusterLists) & length(clusterLists) >= 1) stop("Error......")

  plotdata <- c()
  names <- c()
  intersectionPoints <- c()
  maxYs <- c()
  for (i in 1:length(clusterLists)) {
    a <- metaData %>% dplyr::filter(Cluster == clusterLists[[i]][1]) %>% .$Pseudotime
    b <- metaData %>% dplyr::filter(Cluster == clusterLists[[i]][2]) %>% .$Pseudotime

    xlim <- c(min(c(a, b)), max(c(a, b)))
    df <- merge(
      as.data.frame(density(a, from = xlim[1], to = xlim[2])[c("x", "y")]),
      as.data.frame(density(b, from = xlim[1], to = xlim[2])[c("x", "y")]),
      by = "x", suffixes = c(".a", ".b")
    )

    df$comp <- as.numeric(df$y.a > df$y.b)
    df$cross <- c(NA, diff(df$comp))
    intersectionPoint <- df[which(df$cross != 0), "x"]
    if (length(intersectionPoint) > 1) {
      intersectionPoint <- df[which(df$cross == (-1)), "x"]
      intersectionPoint <- max(intersectionPoint)
    }
    intersectionPoints[i] <- intersectionPoint

    if (i == length(clusterLists)) {
      plotdata1 <- rbind.data.frame(
        data.frame(CellType = clusterLists[[i]][1], time = a),
        data.frame(CellType = clusterLists[[i]][2], time = b)
      )
      names[i+1] <- clusterLists[[i]][2]
    } else {
      plotdata1 <- data.frame(CellType = rep(clusterLists[[i]][1], length(a)), time = a)
    }

    plotdata <- rbind.data.frame(plotdata, plotdata1)
    names[i] <- clusterLists[[i]][1]
    maxYs <- c(maxYs, max(c(max(df$y.a), max(df$y.b))))
  }
  maxY <- max(maxYs)

  allIntersectionPoints <- c(min(metaData$Pseudotime), intersectionPoints, max(metaData$Pseudotime))

  if(plot) {
    library(ggplot2)

    plotdata$CellType <- factor(plotdata$CellType, levels = names)

    if (is.null(colorSets)) colorSets <- c("#008B00", "#009900", "#82bc25", "#cede51","#fff68e", "#ffff33", "#ccff66")

    x_index <- split(plotdata[["time"]], plotdata[["CellType"]])
    bg_data <- as.data.frame(t(sapply(x_index, range)))
    colnames(bg_data) <- c("xmin", "xmax")
    bg_data[["group.by"]] <- names(x_index)

    bg_data[["ymin"]] <- 0
    bg_data[["ymax"]] <- Inf
    bg_data[["fill"]] <- colorSets[1:length(names)]

    xmin <- c()
    xmax <- c()
    if (length(names) > 1) {
      for (x in 1:length(names)) {
        if (x == 1) {
          xmin[x] = min(plotdata$time)
          xmax[x] = intersectionPoints[x]
        } else if(x == length(names)) {
          xmin[x] = intersectionPoints[x-1]
          xmax[x] = max(plotdata$time)
        } else {
          xmin[x] = intersectionPoints[x-1]
          xmax[x] = intersectionPoints[x]
        }
      }
    }
    bg_data[["xmin"]] <- xmin
    bg_data[["xmax"]] <- xmax

    bg_layer <- geom_rect(data = bg_data,
                          xmin = bg_data[["xmin"]], xmax = bg_data[["xmax"]],
                          ymin = bg_data[["ymin"]], ymax = bg_data[["ymax"]],
                          fill = bg_data[["fill"]],
                          alpha = 0.2,
                          inherit.aes = FALSE)

    p <- ggplot(data = plotdata, aes(x = time))
    p <- p + bg_layer
    p <- p +
      geom_density(aes(color = CellType)) +
      geom_density(aes(fill = CellType), alpha = 0.8) +
      geom_vline(xintercept = intersectionPoints, color = "#df1d79", linetype = "dashed") +
      scale_fill_manual(values = colorSets) +
      labs(x = "Pseudo time", y = "Density") +
      scale_x_discrete(expand = c(0, 0)) +
      scale_y_discrete(expand = c(0, 0)) +
      theme_bw()
    p <- p + theme(legend.position="bottom")

    yPoints <- c()
    xwindow <- c()
    ywindow <- c()
    for (w in 1:length(clusterLists)) {
      yPoints <- c(yPoints, maxY*w/length(names))
      xwindow <- c(xwindow, mean(c(allIntersectionPoints[w], allIntersectionPoints[w+2])))
      ywindow <- c(ywindow, maxY*w/length(names)+0.1)
    }

    line_data <- data.frame(x = allIntersectionPoints[1:length(clusterLists)],
                            xend = allIntersectionPoints[(length(allIntersectionPoints)-length(clusterLists)+1):length(allIntersectionPoints)],
                            y = sort(yPoints, decreasing = TRUE),
                            xwindow = xwindow,
                            ywindow =sort(ywindow, decreasing = TRUE),
                            window = paste0("Window", 1:length(clusterLists)))

    p <- p + geom_segment(data = line_data,
                          aes(x = x, xend = xend,
                              y = y, yend = y),
                          color = "gray70",
                          size = 1.3,
                          arrow = arrow(angle = 15, type = "closed")) +
      geom_text(data = line_data,
                # size = 5,
                aes(x = xwindow,
                    y = ywindow,
                    label = window))

    print(p)
    if (!is.null(fileSave))
      cowplot::ggsave2(file = fileSave,
                       p,
                       width = 15,
                       height = 6,
                       units = "cm",
                       dpi = 600)
  }

  return(allIntersectionPoints)
}
目前代码可能仍有一些bug,欢迎提出修改及改进意见。


 1725
1725


 被折叠的 条评论
为什么被折叠?
被折叠的 条评论
为什么被折叠?
 到【灌水乐园】发言


