


可在线定制echarts.min.js版本 ECharts 在线构建
一. 先下载mpvue-echarts组件
链接: https://pan.baidu.com/s/1j8f-i2YmKqZMl_QfheqgCQ?pwd=ujxg
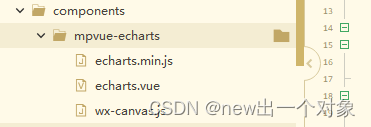
二. 再把下载的文件放在components文件夹下
三. 最后在页面引入
<template>
	<view>
		<view style="height:800rpx;">
			<mpvue-echarts :onInit="initWX_echarts">
			</mpvue-echarts>
		</view>
	</view>
</template>

<script>
	import * as echarts from '@/components/mpvue-echarts/echarts.min.js';
	import mpvueEcharts from '@/components/mpvue-echarts/echarts.vue';
	let echartsOption = {}
	export default {
		components: {
			mpvueEcharts
		},
		data() {
			return {}
		},
		onLoad(options) {},

		mounted() {
			this.initEcharts()
		},

		methods: {
			initWX_echarts(canvas, width, height) {
				let chart = echarts.init(canvas, null, {
					width: width,
					height: height
				});
				canvas.setChart(chart)
				chart.setOption(echartsOption);
				return chart
			},

			async initEcharts() {
				let seriesData = [
					["18", "19", "20", "21", "22", "23", "24", "25", "26", "27", "28"],
					[63, 86, 53, 10, 30, 36, 40, 39, 12, 44, 45],
					[69, 75, 96, 11, 37, 36, 80, 34, 89, 32, 11],
					[29, 65, 76, 91, 87, 66, 40, 44, 29, 12, 33],
				]

				let series = [{
					"name": "1路",
					"type": "line",
					"seriesLayoutBy": "row"
				}, {
					"name": "2路",
					"type": "line",
					"seriesLayoutBy": "row"
				}, {
					"name": "3路",
					"type": "line",
					"seriesLayoutBy": "row"
				}, ]

				let option = {
					legend: {
						// 开启图例点击交互
						selectedMode: true,
						data: series,
						right: 0,
					},
					tooltip: {
						trigger: "axis",
						axisPointer: {
							type: "cross",
							label: {
								backgroundColor: "#6a7985",
							},
						},
					},
					grid: {
						top: 100
					},
					dataset: {
						source: seriesData
					},
					xAxis: {
						type: 'category',
						boundaryGap: false,
						name: "",
						nameLocation: 'middle', //轴位置
						nameGap: 26, //name名字与轴线间距
					},
					yAxis: {
						gridIndex: 0,
						// 整条y轴
						axisLine: {
							show: true
						},

					},
					series: series
				};


				echartsOption = option
			},

		},

	}
</script>

<style lang="scss" scoped>
</style>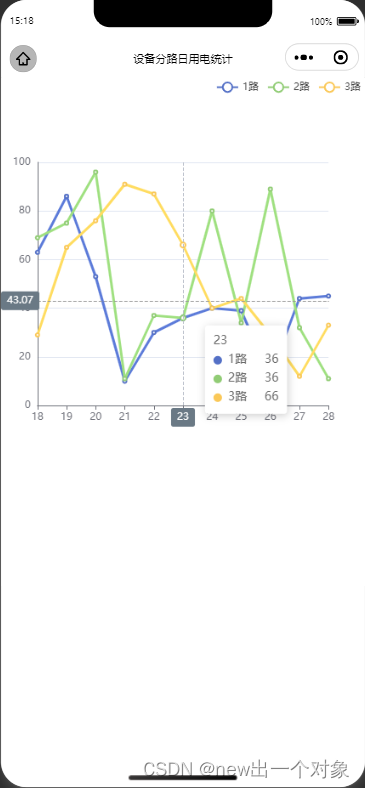


 2019
2019


 被折叠的 条评论
为什么被折叠?
被折叠的 条评论
为什么被折叠?
 到【灌水乐园】发言


