


 本文介绍了使用Python的Flask框架和Echarts库构建疫情监控系统的全过程,包括数据爬取(腾讯疫情、百度热搜),数据处理与存储(MySQL),Web程序开发(Flask基础及模板制作)以及项目部署(Linux环境)。文章详细讲解了爬虫技术(urllib, requests, BeautifulSoup, re)和数据库交互,同时展示了如何在Linux上部署Flask应用。
🙋作者:爱编程的小贤
⛳知识点:Flask、前端、Echarts、Linux
🥇:每天学一点,早日成大佬
文章目录
🥊一、项目概述
1.1项目介绍
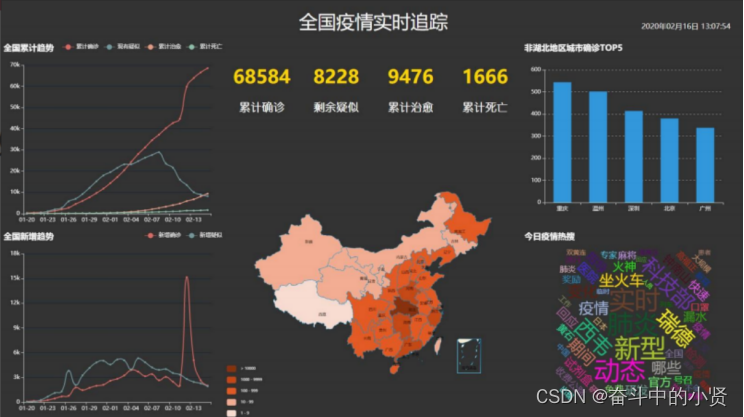
本项目是一个基于 Python + Flask + Echarts 打造的一个疫情监控系统,涉及到的技术有:
- Python 网络爬虫
- 使用 Python 与 MySQL 数据库交互
- 使用 Flask 构建 web 项目
- 基于 Echarts 数据可视化展示
- 在 Linux 上部署 web 项目及爬虫
效果展示:
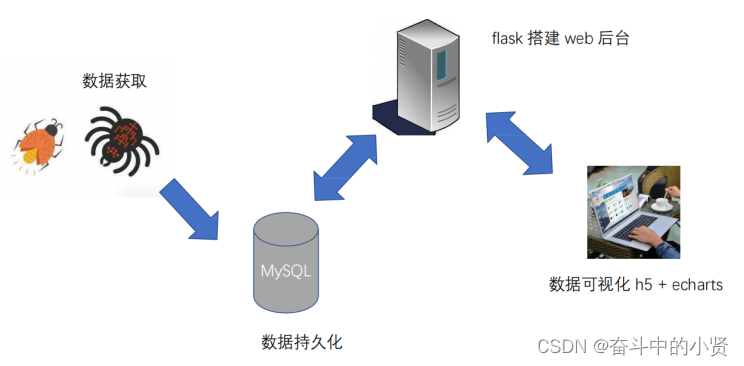
1.2项目架构
1.3 项目环境准备
- Python 3.x
- MySQL5.7或8.0
- PyCharm (Python IDE)
- Jupyter notebook (Pyhon IDE)
- Linux 主机(后期项目部署)
1.4 notebook
Jupyter Notebook(此前被称为 IPython notebook)是一个基于网页的用于交互计算的应用程序,在数据科学领域很受欢迎。
简言之,notebook 是以网页的形式打开,可以在 code 类型单元格中直接编写代码和运行代码,代码的运行结果也会直接在代码块下显示。如在编程过程中需要编写说明文档,可在 markdown 类型的单元格中直接编写,便于作及时
的说明和解释
 - 安装
	pip install notebook
 - 启动:
	jupyter notebook
 - 修改工作目录
	① jupyter notebook --generate-config
	②编辑 jupyter_notebook_config.py 文件
 - notebook 的基本操作
	① 新建文件与导入文件
	② 单元格分类:code 、markdown
	③ 命令模式(蓝色边框)与编辑模式(绿色边框) ④ 常用快键键
	单元格类型转换:Y 、M; 插入单元格:A、B;
	运行单元格:ctrl / shift / alt + enter 删除单元格:DD
🥊二、数据获取
2.1 爬虫概述
爬虫,就是给网站发起请求,并从响应中提取需要的数据的自动化程序。
爬虫步骤:
1. 确定目标的url
2. 发送请求,获取响应
通过 http 库,对目标站点进行请求。等同于自己打开浏览器,输入网址
常用库:urllib、urllib3、requests
服务器会返回请求的内容,一般为:html、二进制文件(视频,音频)、文档,json 字符串等
3. 解析提取数据
寻找自己需要的信息,就是利用正则表达式或者其他库提取目标信息
常用库:re、beautifulsoup4
4. 保存数据
将解析得到的数据持久化到文件或者数据库中
2.1.1使用 urllib 发送请求
➢request.urlopen()
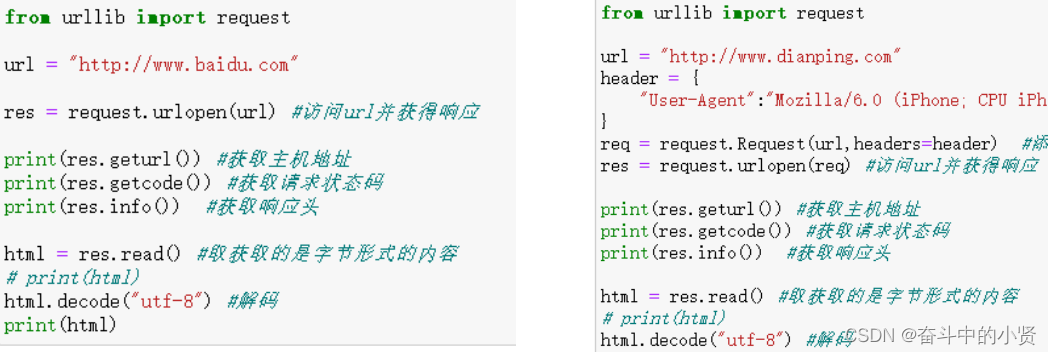
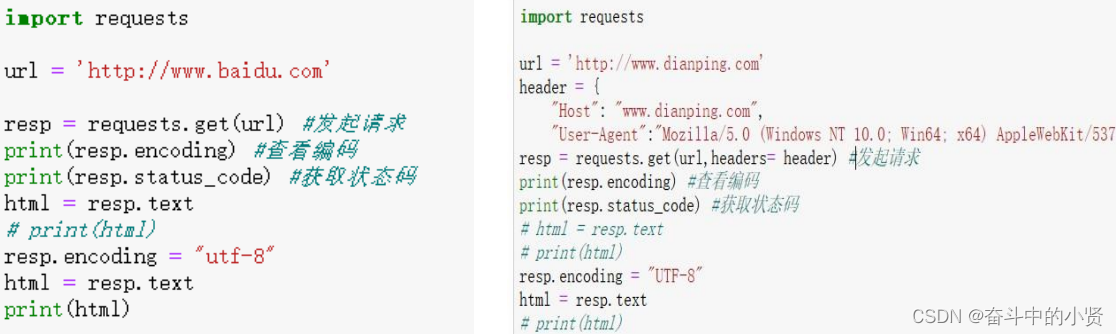
2.1.2使用 requests发送请求
➢安装: pip install requests
➢requests.get()
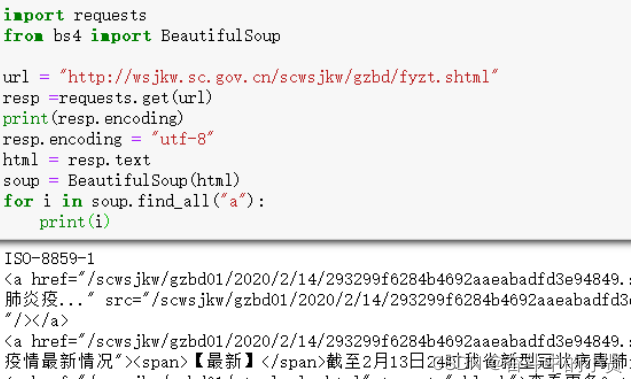
2.1.3使用 beautifulsoup4 解析内容
beautifulsoup4 将复杂的 HTML 文档转换成一个树形结构,每个节点都是 Python 对象
➢安装:pip install beautifulsoup4
➢BeautifulSoup(html)
	➢ 获取节点:find()、find_all()/select()、
	➢ 获取属性:attrs
	➢ 获取文本:text
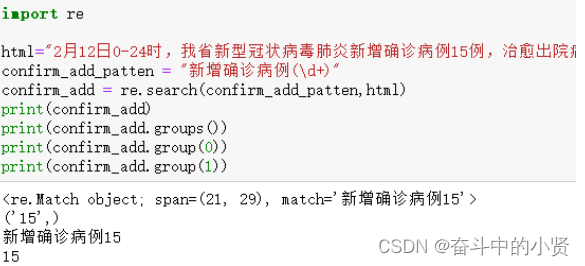
2.1.4使用 re 解析内容
➢re 是 python 自带的正则表达式模块,使用它需要有一定的 正则表达式 基础
➢re.search( regex ,str)
	① 在 str 中查找满足条件的字符串,匹配不上返回None
	② 对返回结果可以分组,可在字符串内添加小括号分离数据:
		groups()
		group(index) : 返回指定分组内容
2.2 爬取腾讯疫情数据(部分代码)
- 有了爬虫基础后,我们可以自行去全国各地的卫健委网站上爬取数据,不过部分网站反爬虫手段很高明,需要专业的反反爬手段
- 我们也可以去各大平台直接爬取最终数据,比如:
百度疫情动态
https://voice.baidu.com/act/newpneumonia/newpneumonia/?from=osari_pc_1
腾讯疫情动态
https://news.qq.com/zt2020/page/feiyan.htm#/ - 获取所有病情数据
当日详情数据
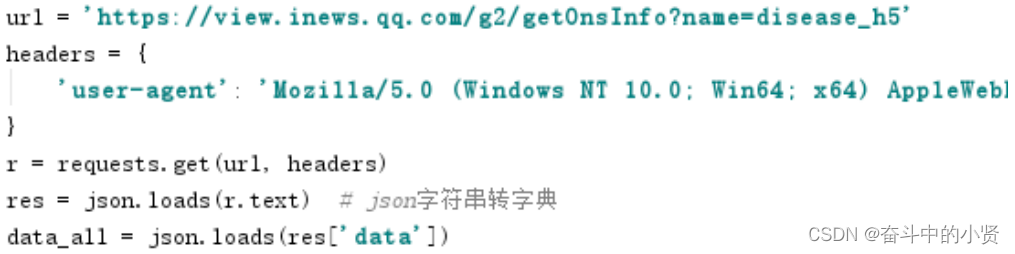
url = "https://api.inews.qq.com/newsqa/v1/query/inner/publish/modules/list?modules=localCityNCOVDataList,diseaseh5Shelf"
response = requests.get(url)
result = json.loads(response.text)
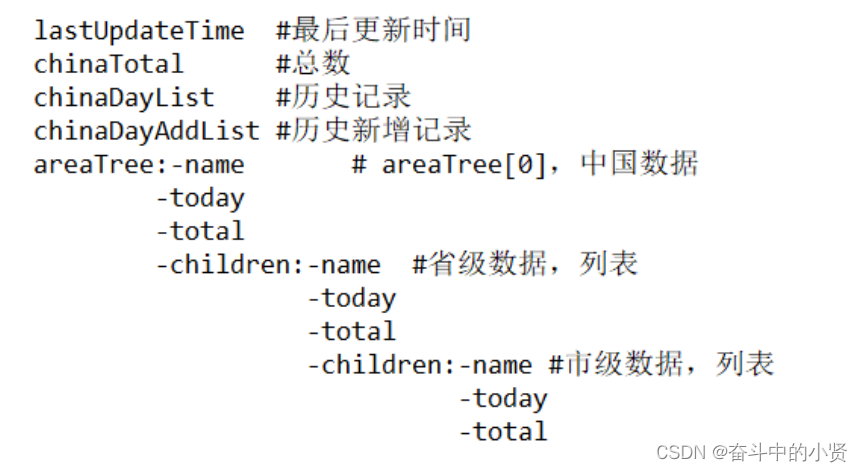
update_time = result['data']['diseaseh5Shelf']['lastUpdateTime']
# 获取省份数据列表
province_data = result['data']['diseaseh5Shelf']['areaTree'][0]['children']
历史数据
 url = "https://api.inews.qq.com/newsqa/v1/query/inner/publish/modules/list?modules=chinaDayListNew,chinaDayAddListNew&limit=30"
    response = requests.get(url)
    result = json.loads(response.text)
    day_data = result['data']['chinaDayListNew']
    day_data_add = result['data']['chinaDayAddListNew']
- 分析与处理
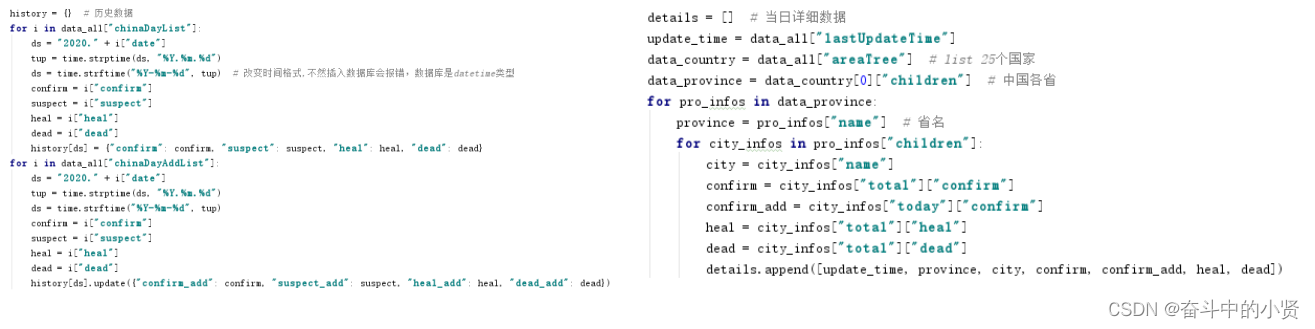
- 数据存储
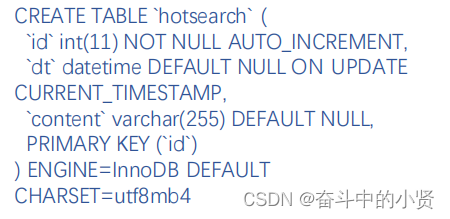
history 表存储每日总数据,details 表存储每日详细数据
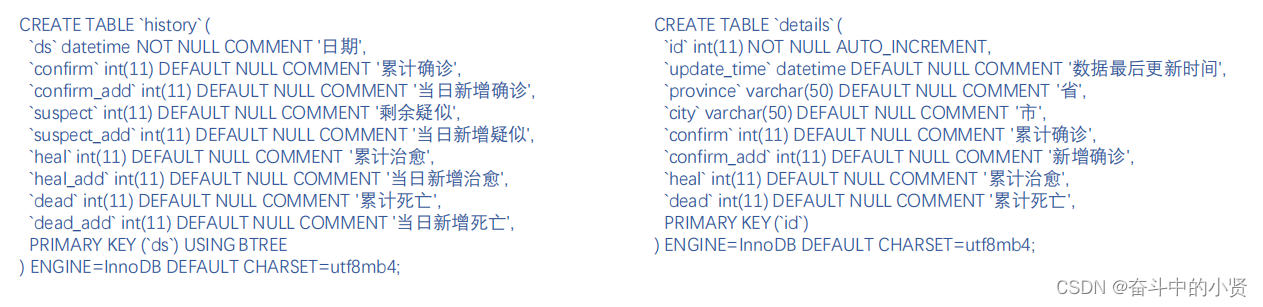
create_history_sql = """
CREATE TABLE IF NOT EXISTS `history` (
`ds` datetime NOT NULL,
`confirm` int(11) DEFAULT NULL,
`confirm_add` int(11) DEFAULT NULL,
`suspect` int(11) DEFAULT NULL,
`suspect_add` int(11) DEFAULT NULL,
`heal` int(11) DEFAULT NULL,
`heal_add` int(11) DEFAULT NULL,
`dead` int(11) DEFAULT NULL,
`dead_add` int(11) DEFAULT NULL,  PRIMARY KEY (`ds`)
);
"""


create_details_sql = """
CREATE TABLE IF NOT EXISTS `details` (
`id` INTEGER PRIMARY KEY AUTOINCREMENT  NOT NULL,
`update_time` datetime DEFAULT NULL,
`province` varchar(50) DEFAULT NULL,
`city` varchar(50) DEFAULT NULL,
`confirm` int(11) DEFAULT NULL,
`confirm_add` int(11) DEFAULT NULL,
`heal` int(11) DEFAULT NULL,
`dead` int(11) DEFAULT NULL
);
"""
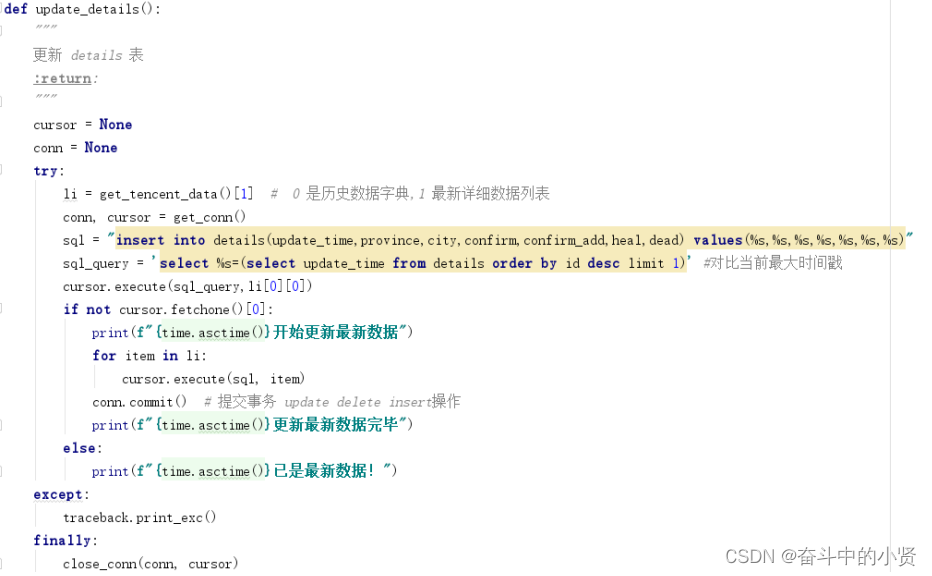
➢使用 pymysql 模块与数据库交互
➢安装: pip install pymysql
① 建立连接
② 创建游标
③ 执行操作
④ 关闭连接
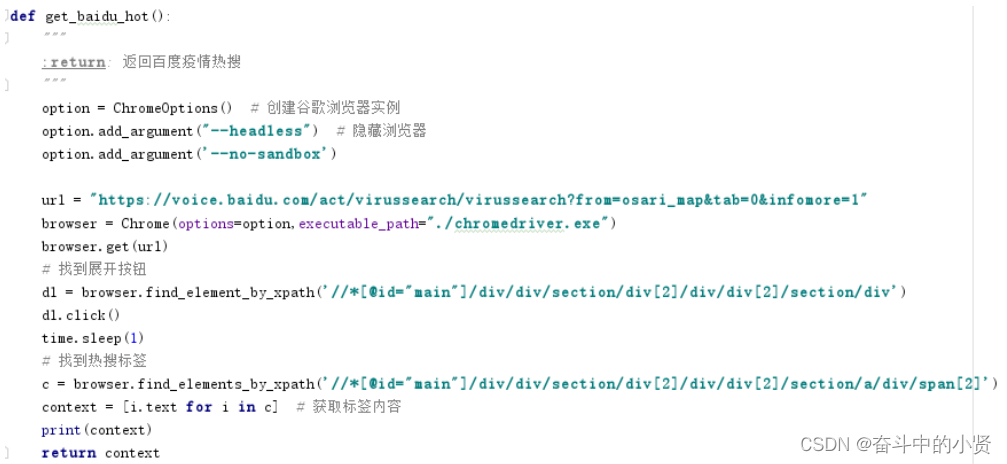
2.3 爬取百度热搜数据(部分代码)
百度的数据页面使用了动态渲染技术,我们可以用 selenium 来爬取
➢selenium 是一个用于 web 应用程序测试的工具,直接运行在浏览器中,就像真正的用
户在操作一样
➢安装: pip install selenium
➢安装浏览器(谷歌、火狐等) ➢下载对应版本浏览器驱动:
谷歌驱动
https://registry.npmmirror.com/binary.html?path=chromedriver/
① 创建浏览器对象
② 浏览器.get()
③ 浏览器.find()
2.3.1数据爬取
2.3.2数据存储
同样,我们也需要把数据存储到mysql 数据库
🥊三、Web程序开发
3.1Flask 快速入门
Flask 是一个使用 Python 编写的轻量级 Web 应用框架。其 WSGI(Python Web Server Gateway Interface) 工具包采用 Werkzeug ,模板引擎则使用 Jinja2 ,是目前十分流行的 web 框架。
• 安装:pip install flask
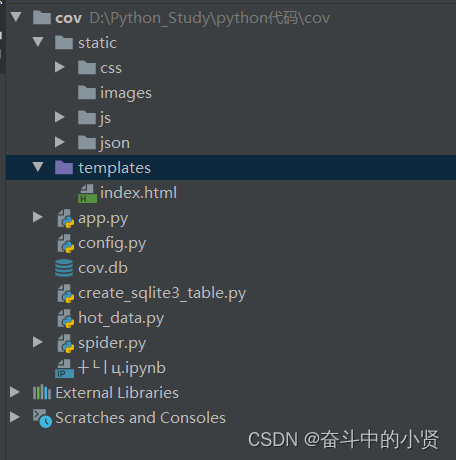
• 创建 Flask 项目
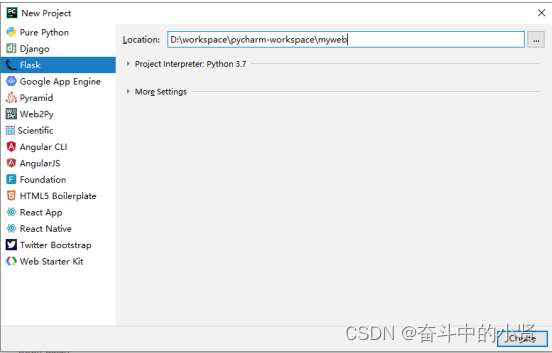
项目结构
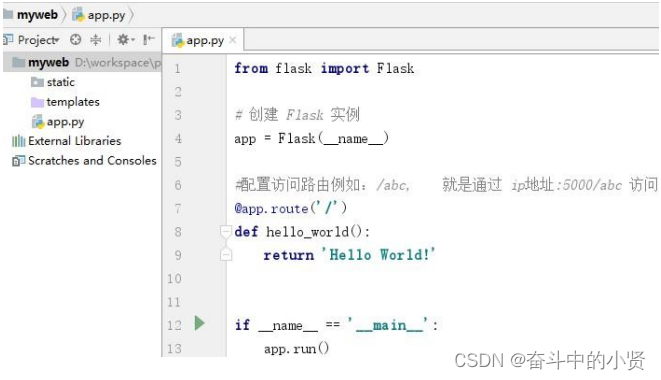
from flask import Flask, jsonify, render_template
import sqlite3
import config

app = Flask(__name__)


@app.route('/', methods=['GET'])
def index():
    return render_template('index.html')


@app.route('/map_data', methods=['GET'])
def map_data():
    conn = sqlite3.connect(config.DB_PATH)
    cursor = conn.cursor()
    cursor.execute("select * from details where city = ''")
    result = []
    for row in cursor.fetchall
最低0.47元/天 解锁文章


 781
781

 被折叠的 条评论
为什么被折叠?
被折叠的 条评论
为什么被折叠?
 到【灌水乐园】发言


