


rescaleAxes()函数在官方文档的说明
翻译:
重新缩放与此绘图仪关联的键轴和值轴,以包含所有显示的数据,从而使整个绘图仪可见。如果轴的缩放是对数的,则RescaleAxis将确保不会重新缩放到非法范围,即包含不同符号和/或零的范围。相反,它将保留在当前符号域中,并忽略位于该域之外的绘图仪的所有部分。
onlyEnlarge确保范围只会扩大,而不会缩小。因此,可以通过多次调用rescaleAxes来整体显示多个绘图表,其中第一次调用仅将“大”设置为false(默认设置),随后所有调用都设置为true。
大概的意思是保证图形比较合理地显示
setRange()函数
setRange()函数在官方中有三个,还有两个请自行在文档中查找。
//这个函数是用来设置轴范围的下限和上限。
void QCPAxis::setRange (double lower, double upper )
官网的例子:
 QCustomPlot* customPlot  = ui->widget;
    // add two new graphs and set their look:
    customPlot->addGraph();
    customPlot->graph(0)->setPen(QPen(Qt::blue)); // line color blue for first graph
    customPlot->graph(0)->setBrush(QBrush(QColor(0, 0, 255, 20))); // first graph will be filled with translucent blue

    customPlot->addGraph();
    customPlot->graph(1)->setPen(QPen(Qt::red)); // line color red for second graph
    // generate some points of data (y0 for first, y1 for second graph):
    QVector<double> x(251), y0(251), y1(251);
    for (int i=0; i<251; ++i)
    {
      x[i] = i;
      y0[i] = qExp(-i/150.0)*qCos(i/10.0); // exponentially decaying cosine
      y1[i] = qExp(-i/150.0);              // exponential envelope
    }
    // configure right and top axis to show ticks but no labels:
    // (see QCPAxisRect::setupFullAxesBox for a quicker method to do this)
    //customPlot->axisRect()->setupFullAxesBox(false);//四边安装轴并显示
    customPlot->xAxis2->setVisible(true);
    customPlot->xAxis2->setTickLabels(false);
    customPlot->yAxis2->setVisible(true);
    customPlot->yAxis2->setTickLabels(false);
    // make left and bottom axes always transfer their ranges to right and top axes:
    connect(customPlot->xAxis, SIGNAL(rangeChanged(QCPRange)), customPlot->xAxis2, SLOT(setRange(QCPRange)));
    connect(customPlot->yAxis, SIGNAL(rangeChanged(QCPRange)), customPlot->yAxis2, SLOT(setRange(QCPRange)));
    // pass data points to graphs:
    customPlot->graph(0)->setData(x, y0);
    customPlot->graph(1)->setData(x, y1);
    // let the ranges scale themselves so graph 0 fits perfectly in the visible area:
    customPlot->graph(0)->rescaleAxes();
    // same thing for graph 1, but only enlarge ranges (in case graph 1 is smaller than graph 0):
    customPlot->graph(1)->rescaleAxes(true);
    //customPlot->xAxis->setRange(0,250);
//    customPlot->yAxis->setRange(-0.8,1);
    // Note: we could have also just called customPlot->rescaleAxes(); instead
    // Allow user to drag axis ranges with mouse, zoom with mouse wheel and select graphs by clicking:
    customPlot->setInteractions(QCP::iRangeDrag | QCP::iRangeZoom | QCP::iSelectPlottables);
正常运行

把如下代码注释掉:
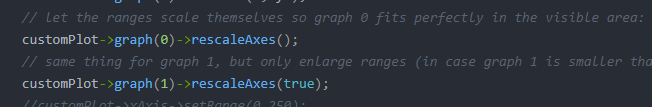
运行时这样子的

加入以下代码限制轴的大小:
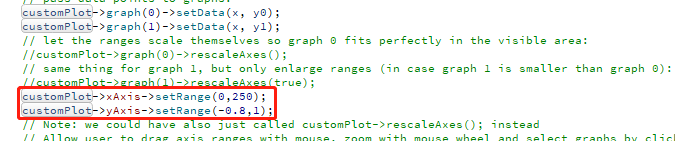
运行结果如下:


 264
264


 被折叠的 条评论
为什么被折叠?
被折叠的 条评论
为什么被折叠?
 到【灌水乐园】发言


