这里接上一篇,继续分享TCR的分析代码
定义TCR相似度的半径(以便于寻找motif,大家注意下面的代码)
"""
Example of TCR radii defined for each TCR in an
antigen enriched repertoire, and logo-motif report.
"""
import os
import numpy as np
import pandas as pd
from tcrdist.repertoire import TCRrep
from tcrdist.sample import _default_sampler
from tcrdist.background import get_stratified_gene_usage_frequency
from tcrdist.centers import calc_radii
from tcrdist.public import _neighbors_sparse_variable_radius, _neighbors_variable_radius
from tcrdist.public import TCRpublic
from tcrdist.ecdf import _plot_manuscript_ecdfs
import matplotlib.pyplot as plt
    # ANTIGEN ENRICHED REPERTOIRE
    # Load all TCRs tetramer-sorted for the epitope influenza PA epitope
df = pd.read_csv("dash.csv").query('epitope == "PA"').\
    reset_index(drop = True)
# Load <df> into a TCRrep instance, to infer CDR1, CDR2, and CDR2.5 region of each clone
tr = TCRrep(cell_df = df.copy(),
            organism = 'mouse',
            chains = ['beta'],
            db_file = 'alphabeta_gammadelta_db.tsv',
            compute_distances = True)
    # UN-ENRICHED REPERTOIRE
    # For illustration we pull a default sampler for mouse beta chains.
    # This is used to estimate the gene usage
    # probabilities P(TRBV = V, TRBJ = J)
ts = _default_sampler(organism = "mouse", chain = "beta")()
ts = get_stratified_gene_usage_frequency(ts = ts, replace = True)
    # Then we synthesize a background using Olga (Sethna et al. 2019),
    # using the P(TRBV = V, TRBJ = J) for inverse probability weighting.
df_vj_background = tr.synthesize_vj_matched_background(ts = ts, chain = 'beta')
    # Load <df_vj_background> into a TCRrep instance, to infer CDR1,CDR2,CDR2.5
trb = TCRrep(cell_df = df_vj_background.copy(),
            organism = 'mouse',
            chains = ['beta'],
            db_file = 'alphabeta_gammadelta_db.tsv',
            compute_distances = False)
    # Take advantage of multiple CPUs
tr.cpus = 4
    # Compute radii for each TCR that controls neighbor-discovery in the background at
    # estimate of 1/10^5 inverse probability weighted TCRs.
    # Note we are set <use_sparse> to True, which allows us to take advantage of
    # multiple cpus and only store distance less than or equal to <max_radius>
radii, thresholds, ecdfs = \
    calc_radii(tr = tr,
        tr_bkgd = trb,
        chain = 'beta',
        ctrl_bkgd = 10**-5,
        use_sparse = True,
        max_radius=50)
    #  Optional, set a maximum radius
tr.clone_df['radius'] = radii
tr.clone_df['radius'][tr.clone_df['radius'] > 26] = 26
    # Tabulate index of neighboring clones in the ANTIGEN ENRICHED REPERTOIRE,
    # at each TCR-specific radius
tr.clone_df['neighbors'] = _neighbors_variable_radius(
    pwmat = tr.pw_beta,
    radius_list = tr.clone_df['radius'])
    # Tabulate neighboring sequences in background
tr.clone_df['background_neighbors'] = _neighbors_sparse_variable_radius(
    csrmat = tr.rw_beta,
    radius_list = tr.clone_df['radius'])
    # Tabulate number of unique subjects
tr.clone_df['nsubject']             = tr.clone_df['neighbors'].\
        apply(lambda x: tr.clone_df['subject'].iloc[x].nunique())
    # Score Quasi(Publicity) : True (Quasi-Public), False (private)
tr.clone_df['qpublic']              = tr.clone_df['nsubject'].\
        apply(lambda x: x > 1)
    # OPTIONAL: HTML Report
    # Note: you can call TCRpublic() with fixed radius or directly
    # after tr.clone_df['radius'] is defined.
tp = TCRpublic(
    tcrrep = tr,
    output_html_name = "quasi_public_clones.html")
tp.fixed_radius = False
    # Generates the HTML report
rp = tp.report()
    # OPTIONAL: ECDF Figure, against reference
f1 = _plot_manuscript_ecdfs(
    thresholds = thresholds,
    ecdf_mat = ecdfs,
    ylab= 'Proportion of Background TCRs',
    cdr3_len=tr.clone_df.cdr3_b_aa.str.len(),
    min_freq=1E-10)
f1.savefig(os.path.join("", "PA1.png"))
from tcrdist.ecdf import distance_ecdf
tresholds, antigen_enriched_ecdf = distance_ecdf(   pwrect = tr.pw_beta,
    thresholds= thresholds,
    weights=None,
    pseudo_count=0,
    skip_diag=False,
    absolute_weight=True)
# It is straightforward to make a ECDF between antigen enriched TCRs as well:
antigen_enriched_ecdf[antigen_enriched_ecdf == antigen_enriched_ecdf.min()] = 1E-10
f2 = _plot_manuscript_ecdfs(
    thresholds = thresholds,
    ecdf_mat = antigen_enriched_ecdf,
    ylab= 'Proportion of Antigen Enriched PA TCRs',
    cdr3_len=tr.clone_df.cdr3_b_aa.str.len(),
    min_freq=1E-10)
f2.savefig(os.path.join("", "PA2.png"))
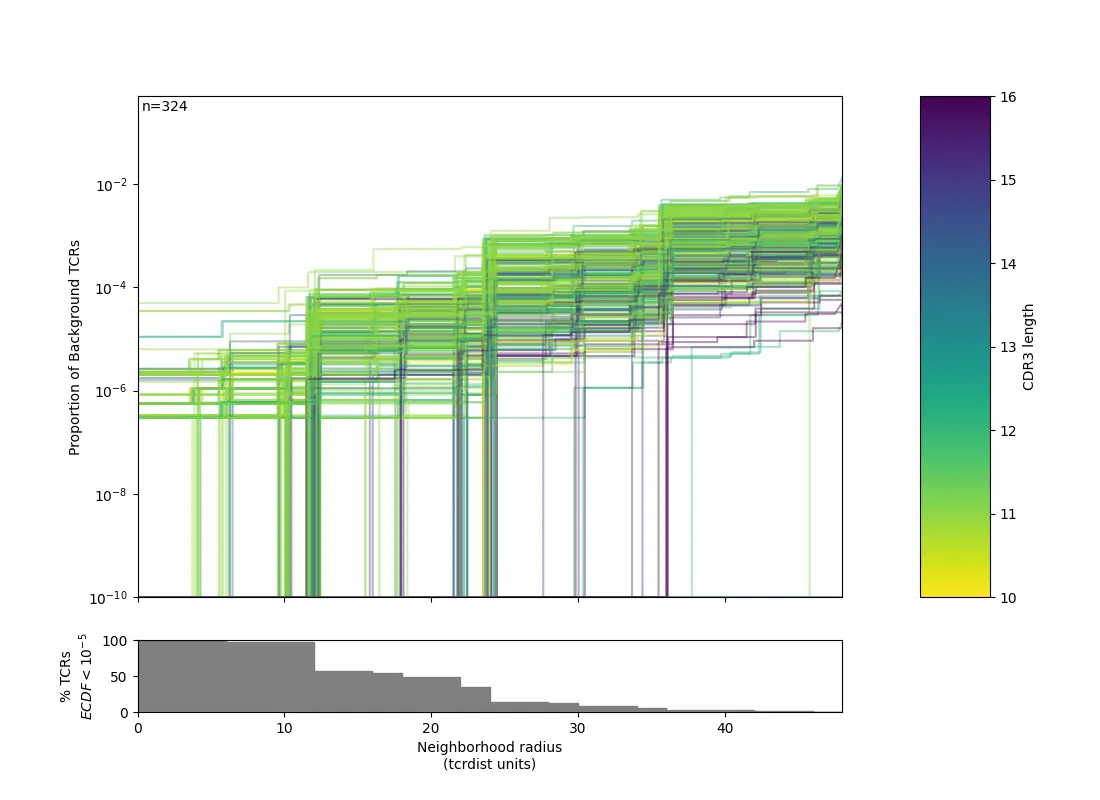
这里对半径的定义个性化程度很高,大家可以自行调节。
(Quasi)Public Clones
Public TCRs are shared clonotypes found in multiple individuals, arising from VDJ recombination biases and common selection pressures. Repertoire analyses often focuses on public clones; however finding public antigen-specific TCRs is not always possible because TCR repertoires are characterized by extreme diversity. As a consequence, only a small fraction of the repertoire can be assayed in a single sample, making it difficult to reproducibly sample TCR clonotypes from an individual, let alone reliably detect shared clonotypes in a population.
Finding similar receptors from multiple individuals provides stronger evidence of shared epitope recognition and reveals mechanistic basis for CDR-peptide-MHC binding.(这个作用当然很好,但是识别起来有困难).
Moreover, meta-clonotypes are by definition more abundant than exact clonotype and thus can be more reliably be detected in a single bulk unenriched sample, facilitating more robust function comparisons across populations.(主要是不能精准查找TCR序列,所以定义半径就显得尤为重要)。
默认参数
For instance, you may want find all the (quasi)public collections of TCRs within a fixed radius <= 18(默认的半径,这个需要根据前面的分析结果进行调整) TCRdist units of each TCR in the antigen enriched input data.
"""
tcrdist3 is particularly useful for finding
what we term quasi-public meta-clonotypes,
collections of biochemically similar TCRs
recognizing the same peptide-MHC.

The easist way to define meta-clonotypes
is to compute pairwise distances between
TCRs found in an antigen-enriched
subrepertoire, abbreviated below as
<aesr>
"""
import os
import pandas as pd
import numpy as np
from tcrdist.repertoire import TCRrep
from tcrdist.public import TCRpublic

    # <aesr_fn> antigen-enriched subrepertoire
fn = os.path.join('tcrdist', 'data','covid19',
    'mira_epitope_55_524_ALRKVPTDNYITTY_KVPTDNYITTY.tcrdist3.csv')
    # <aesr_df> antigen-enriched subrepertoire
df = pd.read_csv(fn)
    # <tr> TCR repertoire
tr = TCRrep(
    cell_df = df[['cohort','subject','v_b_gene', 'j_b_gene','cdr3_b_aa']].copy(),
    organism = 'human',
    chains = ['beta'],
    db_file = 'alphabeta_gammadelta_db.tsv',
    compute_distances = True)

    # <tp> TCRpublic class for reporting publicities, fixed radius 18, 'nsubject > 3'
tp = TCRpublic(
    tcrrep = tr,
    output_html_name = "quasi_public_clones.html")

    # by calling, .report() an html report is made
public = tp.report()

    # Also, the following datafarme are available
    # <clone_df> pd.DataFrame clone_df from tr.clone_df
    # with neighbors and summary measures appended
public['clone_df']
    # <nn_summary> pd.DataFrame with just summary measures
public['nn_summary']
    # <quasi_public_df> Non-redundant groups of quasipublic clones
public['quasi_public_df']
In addition to the summary DataFrames returned, a HTML quasi-publicity report is generated, allowing for the inspection of logo-motifs formed from highly similar antigen-enriched TCR sequences found in multiple subjects.(感兴趣的大家可以尝试一下)。
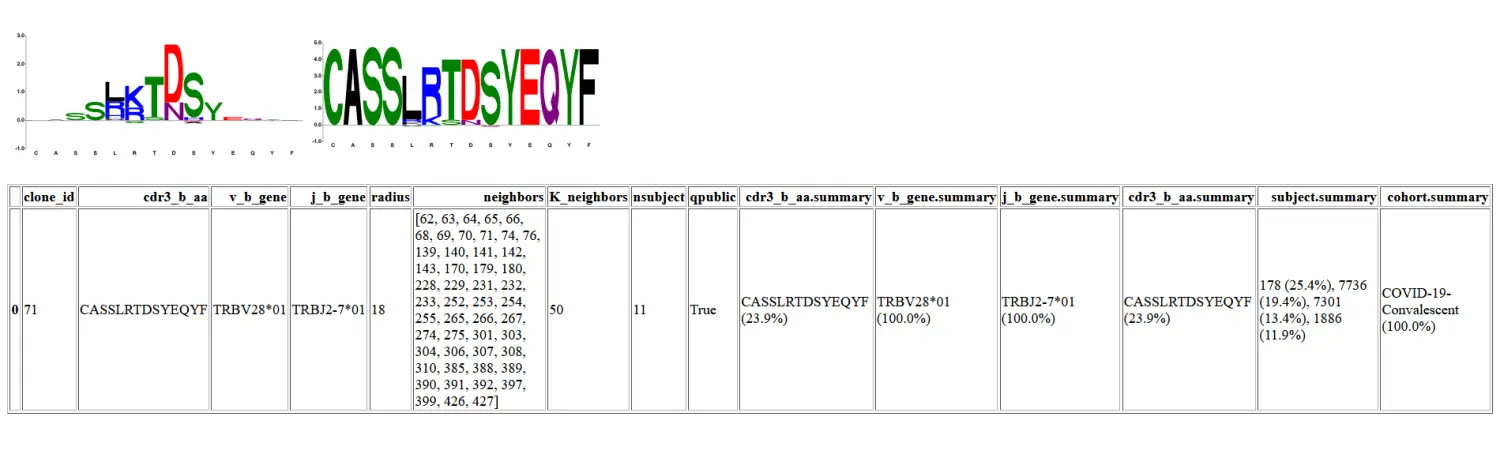
调整一个参数
例如,汇总同类群组信息并将其添加到报告中。
import os
import pandas as pd
import numpy as np
from tcrdist.repertoire import TCRrep
from tcrdist.public import TCRpublic

# <aesr_fn> antigen-enriched subrepertoire
aesr_fn = os.path.join(
    'tcrdist',
    'data',
    'covid19',
    'mira_epitope_55_524_ALRKVPTDNYITTY_KVPTDNYITTY.tcrdist3.csv')

# <aesr_df> antigen-enriched subrepertoire
aesr_df = pd.read_csv(aesr_fn)
# <tr> TCR repertoire
tr = TCRrep(
    cell_df = aesr_df[[
        'cohort',
        'subject',
        'v_b_gene',
        'j_b_gene',
        'cdr3_b_aa']].copy(),
    organism = 'human',
    chains = ['beta'],
    db_file = 'alphabeta_gammadelta_db.tsv',
    compute_distances = True)
# <tp> TCRpublic class for reporting publicities
tp = TCRpublic(
    tcrrep = tr,
    output_html_name = "quasi_public_clones2.html")
# set to True, if we want a universal radius
tp.fixed_radius = True
# must then specify maximum distance for finding similar TCRs
tp.radius = 18
# set criteria for being quasi-public
tp.query_str = 'nsubject > 6'
# Add additional columns to be summarized in the report
tp.kargs_member_summ['addl_cols'] = ['subject', 'cohort']
# Add cohort.summary to the labels column so it shows up in the report
tp.labels.append("cohort.summary")
# by calling, .report() an html report is made
public = tp.report()
报告有一个新的列来总结来自研究中每个队列的 TCR 的百分比,并且元克隆型的数量较少,因为只有那些来自超过 8 个受试者的 TCR 被报告。
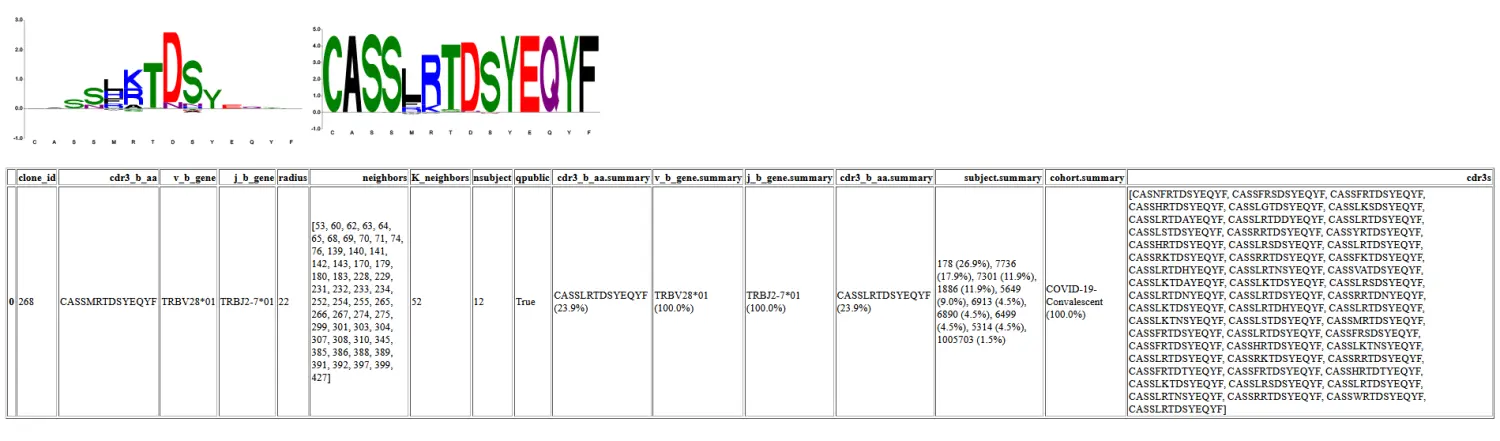
特定于序列的搜索半径
应用于每个质心的半径可以在 clone_df 的列中指定。
"""
Instead of enforcing a fixed radius,
use a radius specific to each
centroid, specified in an additional
column.
"""
import os
import pandas as pd
import numpy as np
from tcrdist.repertoire import TCRrep
from tcrdist.public import TCRpublic

fn = os.path.join(
    'tcrdist',
    'data',
    'covid19',
    'mira_epitope_55_524_ALRKVPTDNYITTY_KVPTDNYITTY.tcrdist3.radius.csv')

df = pd.read_csv(fn)

tr = TCRrep(cell_df = df[['cohort','subject','v_b_gene', 'j_b_gene','cdr3_b_aa', 'radius']],
            organism = "human",
            chains = ["beta"])

tp = TCRpublic(
    tcrrep = tr,
    output_html_name = "quasi_public_clones3.html")

# set to True, if we want a universal radius
tp.fixed_radius = False
# must then specify maximum distance for finding similar TCRs
tp.radius = None
# set criteria for being quasi-public
tp.query_str = 'nsubject > 5'
# Add additional columns to be summarized in the report
tp.kargs_member_summ['addl_cols'] = ['subject', 'cohort']
# Add cohort.summary to the labels column so it shows up in the report
tp.labels.append("cohort.summary")
tp.labels.append("cdr3s")
# Change number of subjects to display
tp.kargs_member_summ['addl_n'] = 10
# by calling, .report() an html report is made
public = tp.report()
Working from neighbor_diff output
"""
Use values from neighborhood_diff
"""
import os
import pandas as pd
import numpy as np
from tcrdist.repertoire import TCRrep
from tcrdist.public import TCRpublic
fn = os.path.join('tcrdist','data','covid19',
    'mira_epitope_55_524_ALRKVPTDNYITTY_KVPTDNYITTY.tcrdist3.radius.csv')
df = pd.read_csv(fn)
tr = TCRrep(cell_df = df[['cohort','subject','v_b_gene', 'j_b_gene','cdr3_b_aa', 'radius']],
            organism = "human",
            chains = ["beta"])

from tcrdist.rep_diff import neighborhood_diff
ndif = neighborhood_diff(   clone_df= tr.clone_df,
                                pwmat = tr.pw_beta,
                                count_col = 'count',
                                x_cols = ['cohort'],
                                knn_radius = 25,
                                test_method = "chi2")
# Add neighbors and other columns of interest
# from neighbor_diff result to the clone_df
tr.clone_df = pd.concat([tr.clone_df, ndif[['neighbors', 'K_neighbors','val_0','ct_0','pvalue']] ], axis = 1)
# Because neighors and K_neighbor are already added to the clone_df
# TCRpublic.report() uses those instead of finding new ones.
tp = TCRpublic(
    tcrrep = tr,
    output_html_name = "quasi_public_clones_with_ndif.html")
# Add any columns neighbor_diff columns
#that you want to display in the final report
tp.labels.append('val_0')
tp.labels.append('ct_0')
tp.labels.append('pvalue')
# chagne sort to be pvalue not publicity
tp.sort_columns = ['pvalue']
# because you are sorting by pvalue, change to True
tp.sort_ascending = True
tp.report()
其他的一些选项
just want to quickly find neighbors and (quasi)public clones
"""
Instead of enforcing a fixed radius,
use a radius specific to each
centroid, specified in an additional
column.
"""
import os
import pandas as pd
import numpy as np
from tcrdist.repertoire import TCRrep
from tcrdist.public import TCRpublic
fn = os.path.join('tcrdist','data','covid19',
    'mira_epitope_55_524_ALRKVPTDNYITTY_KVPTDNYITTY.tcrdist3.radius.csv')
df = pd.read_csv(fn)
tr = TCRrep(cell_df = df[['cohort','subject','v_b_gene', 'j_b_gene','cdr3_b_aa', 'radius']],
            organism = "human",
            chains = ["beta"])

# NEIGHBORS
from tcrdist.public import _neighbors_fixed_radius
from tcrdist.public import _neighbors_variable_radius
# returns lists of lists of all neighbors at fixed of variable radii
_neighbors_fixed_radius(pwmat = tr.pw_beta, radius = 18)
_neighbors_variable_radius(pwmat = tr.pw_beta, radius_list = tr.clone_df.radius)

# returns the number (K) neighbors at fixed or vriable radii
from tcrdist.public import _K_neighbors_fixed_radius
from tcrdist.public import _K_neighbors_variable_radius
_K_neighbors_fixed_radius(pwmat = tr.pw_beta, radius = 18)
_K_neighbors_variable_radius(pwmat = tr.pw_beta, radius_list = tr.clone_df.radius)

# First find neighbors by your favorite method
tr.clone_df['neighbors'] = _neighbors_variable_radius(
    pwmat = tr.pw_beta,
    radius_list = tr.clone_df.radius)
# Once neighbors are added to a clone_df you can easily determine publicity.
tr.clone_df['nsubject']   = tr.clone_df['neighbors'].\
    apply(lambda x: tr.clone_df['subject'].iloc[x].nunique())
tr.clone_df['qpublic']   = tr.clone_df['nsubject'].\
    apply(lambda x: x > 1)
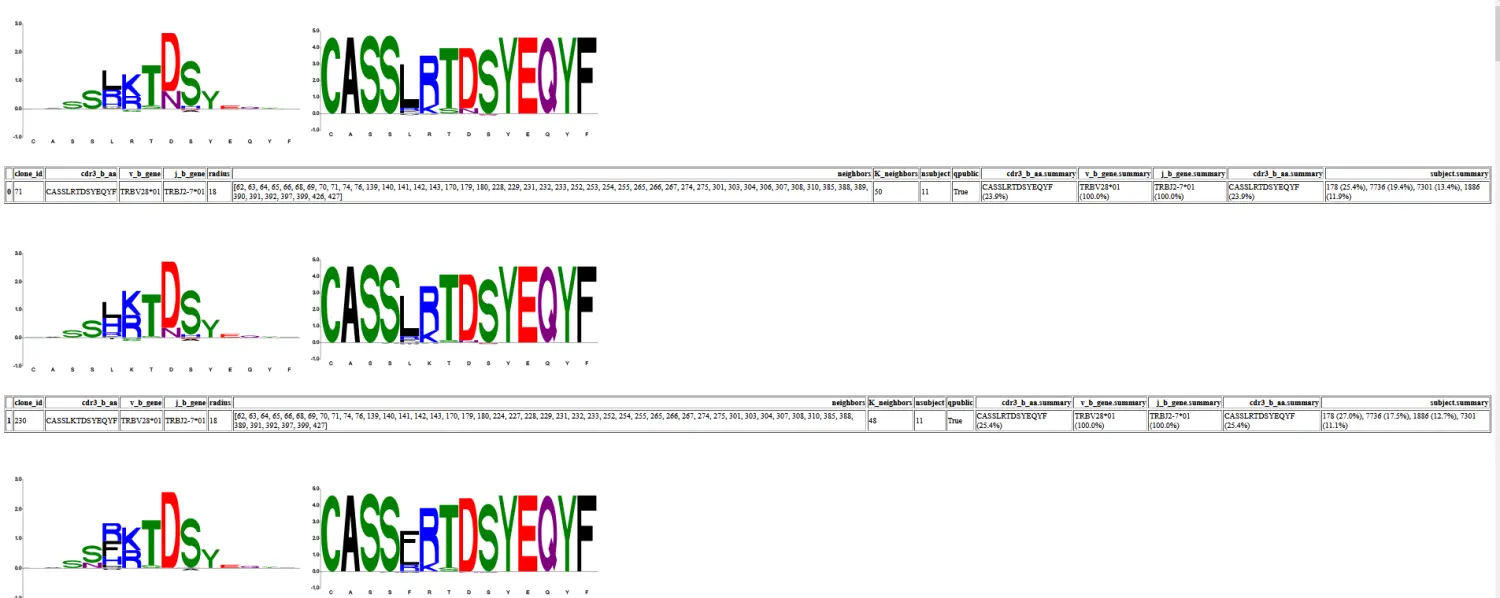
I have neighbors and radii already, I want logos
"""
Report of meta-clonotypes using two dataframes.
<df>  has all TCRS
<df2> has a subset of TCRS in <df>, specifiyint which
are to be used as centroids.
"""
import os
import pandas as pd
import numpy as np
from tcrdist.repertoire import TCRrep
from tcrdist.public import TCRpublic
from tcrdist.tree import _default_sampler_olga
from progress.bar import IncrementalBar
from palmotif import compute_pal_motif, svg_logo
from tcrdist.public import make_motif_logo

output_html_name = "custom_report.html"
# <fn> filename for all TCRs in an antigen-enriched repertoire
fn = os.path.join('tcrdist','data','covid19',
    'mira_epitope_55_524_ALRKVPTDNYITTY_KVPTDNYITTY.tcrdist3.csv.bE5ctrl.centers.csv')
df = pd.read_csv(fn, sep = ",")
df = df[['cdr3_b_aa', 'v_b_gene', 'j_b_gene', 'pgen', 'max_radi']].\
    rename(columns= {'max_radi':'radius'}).copy()

# <fn>2 filename for priority TCRs
fn2 = os.path.join('tcrdist','data','covid19',
    'mira_epitope_55_524_ALRKVPTDNYITTY_KVPTDNYITTY.tcrdist3.csv.bE5ctrl.centers.csv.ranked_centers.tsv')
df2 = pd.read_csv(fn2, sep = "\t").\
    rename(columns= {'max_radi':'radius'}).copy()

# Compute distances between all TCRs
tr = TCRrep(cell_df = df,
    organism = 'human',
    chains = ['beta'],
    compute_distances = True)

# Initialize a tcrsampler, this will be used to make background motifs
tcrsampler = _default_sampler_olga(organism = "human", chain = "beta")()

# Iterate through each row of the df2, making a logo for each.
svgs = list()
svgs_raw = list()
bar = IncrementalBar("Making Logos", max = df2.shape[0])
for i,r in df2.iterrows():
    bar.next()
    svg,svg_raw=make_motif_logo(tcrsampler = tcrsampler,
                        clone_df = tr.clone_df,
                        pwmat = tr.pw_beta,
                        centroid = r['cdr3_b_aa'],
                        v_gene = r['v_b_gene'],
                        radius = r['radius'],
                        pwmat_str = 'pw_beta',
                        cdr3_name = 'cdr3_b_aa',
                        v_name = 'v_b_gene',
                        gene_names = ['v_b_gene','j_b_gene'])
    svgs.append(svg)
    svgs_raw .append(svg_raw)
bar.next(); bar.finish()
df2['svg'] = svgs
df2['svg_raw'] = svgs_raw

def shrink(s):
    """reduce size of svg graphic"""
    s = s.replace('height="100%"', 'height="20%"')
    s = s.replace('width="100%"', 'width="20%"')
    return s

# Choose columns to include in the report
labels = [  'cdr3_b_aa',
            'v_b_gene',
            'j_b_gene',
            'radius',
            'regex',
            'target_hits',
            'nsubject',
            'chi2joint']

with open(output_html_name, 'w') as output_handle:
    for i,r in df2.iterrows():
        #import pdb; pdb.set_trace()
        svg, svg_raw = r['svg'],r['svg_raw']
        output_handle.write("<br></br>")
        output_handle.write(shrink(svg))
        output_handle.write(shrink(svg_raw))
        output_handle.write("<br></br>")
        output_handle.write(pd.DataFrame(r[labels]).transpose().to_html())
        output_handle.write("<br></br>")
会生成一个网页报告
Will this work with sparse matrix options?
tcrdist3 has a memory efficient options for larger datasets that produce scipy.sparse rather than dense representations of distance relationships.
Currently you can’t call TCRpublic() on this sparse representation. However, here is an example of how you can achieve similar results via a script, reporting (quasi)Public meta-clonotypes from a sparse format.(平民化了)。
"""
Making a meta-clonotype report from a
scipy.sparse TCRdist matrix.
"""
import numpy as np
import pandas as pd
from tcrdist.repertoire import TCRrep
from tcrdist.public import _neighbors_sparse_fixed_radius, _neighbors_sparse_variable_radius
from tcrdist.summarize import test_for_subsets
from tcrdist.tree import _default_sampler_olga
from tcrdist.public import make_motif_logo_from_index

df = pd.read_csv("dash.csv").query('epitope == "PA"')
tr = TCRrep(cell_df = df,               #(2)
            organism = 'mouse',
            chains = ['beta'],
            db_file = 'alphabeta_gammadelta_db.tsv',
            compute_distances = False)
    # When setting the radius to 50, the sparse matrix
    # will convert any value > 50 to 0. True zeros are
    # repressented as -1.
radius = 50
tr.cpus = 1
    # Notice that we called .compute_sparse_rect_distances instead of .compute_distances
tr.compute_sparse_rect_distances(df = tr.clone_df, radius = radius)

    # There are two functions for finding neighbors from a sparse TCRdist matrix.
    # For 1 fixed radius: _neighbors_sparse_fixed_radius()
    # For a radius per row: _neighbors_sparse_variable_radius()
tr.clone_df['radius'] = 12
tr.clone_df['neighbors'] = \
    _neighbors_sparse_variable_radius(
        csrmat = tr.rw_beta,
        #radius = 12)
        radius_list = tr.clone_df['radius'].to_list())

    # <K_neighbors>the number of neighbors per TCR
tr.clone_df['K_neighbors'] = tr.clone_df['neighbors'].apply(lambda x: len(x))
    # <nsubject> the number of subject (nsubject) neighboring the TCR (
tr.clone_df['nsubject'] = tr.clone_df['neighbors'].apply(lambda x: len(tr.clone_df['subject'][x].unique()))
    # nsubject > 1 implies quasi-publicity)
tr.clone_df['qpublic'] = tr.clone_df['nsubject'].apply(lambda x: x >1 )

    # e.g., For the report, focus on TCRs with more than 5 neighboring subjects
quasi_p


 最低0.47元/天 解锁文章


 779
779


 被折叠的 条评论
为什么被折叠?
被折叠的 条评论
为什么被折叠?
 到【灌水乐园】发言


