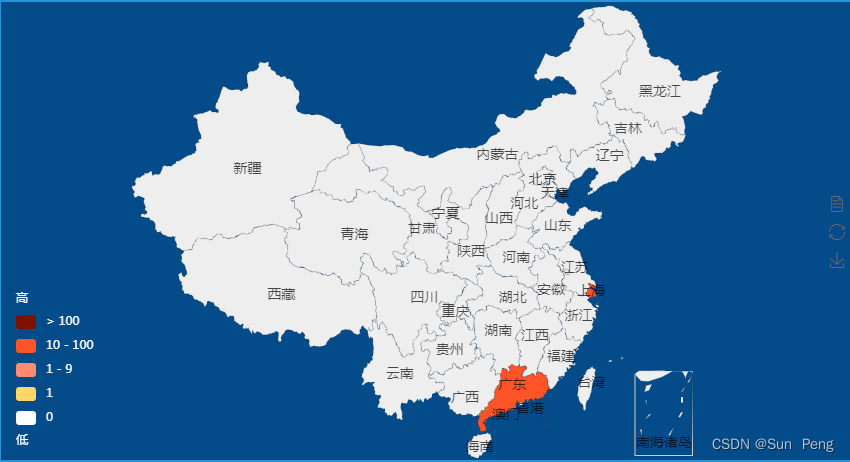
1、实现效果:

2、使用特定版本号:
npm install echarts@4.8 --save //以前的版本有china.js
<template>
	<div class="mapMain">
		<section class="section">
			<div id="map" :style="{ height: '100%', width: '100%' }" />
		</section>
	</div>
</template>

<script>
import * as echarts from 'echarts'
require('echarts/theme/macarons') // echarts theme
import 'echarts/map/js/china.js'

export default {
	data() {
		return {

		}
	},
	mounted() {
		this.init()
	},
	methods: {
		init() {
			// 基于准备好的dom,初始化echarts实例
			let chinaMap = echarts.init(document.getElementById("map"));
			window.onresize = chinaMap.resize; // 窗口或框架被调整大小时执行chinaMap.resize
			chinaMap.setOption({
				tooltip: {
					trigger: 'item',
					formatter: function (e, t, n) {
						return e.value == 'NaN' ? e.name + ":" + '0' : e.name + ":" + e.value
					}
				},
				legend: {
					orient: 'vertical',
					left: 'left',
				},
				visualMap: {
					min: 0,
					max: 10000,
					left: 10,
					bottom: 10,
					showLabel: !0,
					text: ["高", "低"],
					textStyle: {
						color: '#fff',
					},
					pieces: [{
						gt: 100,
						label: "> 100",
						color: "#7f1100"
					}, {
						gte: 10,
						lte: 100,
						label: "10 - 100",
						color: "#ff5428"
					}, {
						gte: 1,
						lt: 10,
						label: "1 - 9",
						color: "#ff8c71"
					}, {
						gt: 0,
						lt: 1,
						label: "1",
						color: "#ffd768"
					}, {
						value: 0,
						color: "#ffffff"
					}],
					show: !0
				},
				toolbox: {
					show: true,
					orient: 'vertical',
					left: 'right',
					top: 'center',
					feature: {
						dataView: { readOnly: false },
						restore: {},
						saveAsImage: {}
					},
				},
				geo: {
					map: "china",
					roam: !1,
					scaleLimit: {
						min: 1,
						max: 2
					},
					zoom: 1.23,
					// top: 120,
					label: {
						normal: {
							show: !0,
							fontSize: "14",
							color: "rgba(0,0,0,0.7)"
						}
					},
					itemStyle: {
						normal: {
							//shadowBlur: 50,
							//shadowColor: 'rgba(0, 0, 0, 0.2)',
							borderColor: "rgba(0, 0, 0, 0.2)"
						},
						emphasis: {
							areaColor: "#f2d5ad",
							shadowOffsetX: 0,
							shadowOffsetY: 0,
							borderWidth: 0
						}
					}
				},
				series: [
					{
						type: 'map',
						mapType: 'china',
						roam: false,
						geoIndex: 0,
						label: {
							normal: {
								show: true
							},
							emphasis: {
								show: true
							}
						},
						data: [
							{ name: '上海', value: 10 },
							{ name: '广东', value: 100 },
						]
					}
				]
			})
		},
	}
}
</script>
3、使用china.js文件(不需要安装特定版本号):
npm install echarts --save-dev
<template>
  <div class='main'>
        <div id="main" style="width: 100%; height: 500px"></div>
  </div>
</template>

<script>
import * as echarts from 'echarts'
import '@/utils/china.js'

export default {
  name: "Home",
  data() {
    return {

    }
  },
  mounted() {
    const options = {
      //标题样式
      title: {
        text: '中国疫情地图',
        x: "center",
        y: '0%',
        textStyle: {
          fontSize: 20,
          color: "#333"
        },
      },
      //这里设置提示框 (鼠标悬浮效果)
      tooltip: {
        //数据项图形触发
        trigger: 'item',
        //提示框浮层的背景颜色。 (鼠标悬浮后的提示框背景颜色)
        backgroundColor: "white",
        //字符串模板(地图): {a}(系列名称),{b}(区域名称),{c}(合并数值),{d}(无)
        formatter: '地区:{b}<br/>现有确诊病例:{c}'
      },
      //视觉映射组件
      visualMap: {
        top: 'center',
        left: 'left',
        // 数据的范围
        min: 10,
        max: 100,
        text: ['高', '低'],
        realtime: true,  //拖拽时,是否实时更新
        calculable: true,  //是否显示拖拽用的手柄
        inRange: {
          // 颜色分布
          color: ['white', 'Tomato', 'orangered']
        }
      },
      series: [
        {
          name: '确诊',
          type: 'map',
          mapType: 'china',
          roam: true,
          //是否开启鼠标缩放和平移漫游
          itemStyle: {
            //地图区域的多边形 图形样式
            normal: {
              //是图形在默认状态下的样式
              label: {
                show: true,//是否显示标签
                textStyle: {
                  color: "black"
                }
              }
            },
            zoom: 1,
            //地图缩放比例,默认为1
            emphasis: {
              //是图形在高亮状态下的样式,比如在鼠标悬浮或者图例联动高亮时
              label: {show: true}
            }
          },
          top: '0%',
          left: '15%',
          data: []
        }
      ]
    }
    var chartDom = document.getElementById('main');
    var myChart = echarts.init(chartDom);

    // 获取数据
    this.request.get("/echarts/epidemic").then(res => {
      this.total = res.data.chinaTotal.total
      this.today = res.data.chinaTotal.today
      this.extData = res.data.chinaTotal.extData

      let data = [ {name: '南海诸岛', value: 0} ]
      res.data.areaTree[2].children.forEach(item => {
        data.push({ name: item.name, value: item.total.confirm - item.total.dead - item.total.heal })

        options.series[0].data = data
        myChart.setOption(options)
      })
    })
  },
  methods:{

  }
}
</script>
下载地址(点击)
里面存在乱码是正常情况(打包压缩引起的)


 1926
1926

 被折叠的 条评论
为什么被折叠?


