一、需求:
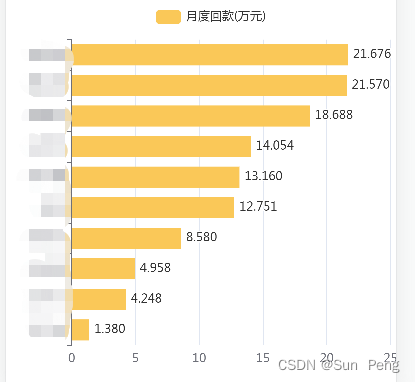
图表的高度根据内容的多少来决定的

二、解决:
<!--
	应收账款统计页面
 -->
<template>
	<view class="content page">
		<view>
			<view style="width: 750rpx;">
				<calendarMonth ref="calendar" z-index="99999999" range-bg-color="#d43b37" active-bg-color="#d43b37" @calendarMonth="calendarMonth" @changeMonth="changeMonthFun"></calendarMonth>
			</view>
		</view>

		<view class="container">
			<!-- 图2 -->
			<view>
				<view style="padding: 10px 0 10px 10px;font-weight: 900;color: #999;">月度回款分布情况</view>
				<div id="Echarts" class="echars_bg" style="background: #fff;padding: 10px;"></div>
			</view>
		</view>
	</view>
</template>

<script>
	import * as echarts from 'echarts'
	import calendarMonth from '@/components/calendarMonth.vue'

	export default {
		components: {calendarMonth},
		data() {
			return {
				totalMoney: '', //number false 金额总和。单位:元
				receiptsMoney: '', //回款金额
				month: '', //月份
				receiptsTimeStart: '', //string false 查询的实收日期开始时间。yyyy-MM-dd HH:mm:ss
				receiptsTimeEnd: '', //string false 查询的实收日期结束时间。yyyy-MM-dd HH:mm:ss
				isclick: true,

				//图
				echart2Name: [],
				echart2Data: [],
				chart: null,
			}
		},
		mounted() {
			this.echart();
		},
		methods: {
			//修改月份
			changeMonthFun(e) {
				this.receiptsTimeStart = e.replace('/', '-') + '-01 00:00:00'
				this.receiptsTimeEnd = e.replace('/', '-') + '-30 23:59:59'

				//关于echarts 清空上一次加载的数据问题:=>解决dom已加载问题
				if (this.chart != null && this.chart != '' && this.chart != undefined) {
					this.chart.dispose(); //销毁
				}
				this.echart();

				this.isclick = false
			},
			// 图
			echart() {
				const that = this
				this.echart2Name = [];
				this.echart2Data = [];
				let EchartData = [] //回款记录的列表全部数据
				this.questFun('returnedMoneyRecord/submitUserReceiptsTotal', 'get', 'bd', {
					receiptsTimeStart: this.receiptsTimeStart,
					receiptsTimeEnd: this.receiptsTimeEnd,
					isTotalMoneyDescSort: 1 //是否按金额降序排序。1=是,0或其它=否
				}, (res) => {
					if (res.data.code == 0) {
						if (res.data.data.list.length> 0) {
							EchartData = res.data.data.list
							res.data.data.list.forEach((item) => {
								that.echart2Name.push(item.submitName || '-')
								item.totalMoney = (item.totalMoney / 10000).toFixed(3)
								that.echart2Data.push(item.totalMoney);
							})
						}
						if (res.data.data.total == 0) {
							document.getElementById('Echarts').style.height = '100px'
						} else {
							document.getElementById('Echarts').style.height = (70 + res.data.data.total * 30) + 'px'
						}
						this.chart = echarts.init(document.getElementById('Echarts'))
						this.chart.clear()
						this.chart.setOption({
							tooltip: {
								show: false, //是否显示提示框组件,包括提示框浮层和 axisPointer。
								trigger: 'none', //触发类型。item,axis,none
							},
							legend: {
								orient: 'vertical',
								x: 'center', //可设定图例在左、右、居中
								y: 'top', //可设定图例在上、下、居中
								padding: [0, 0, 0, 0], //可设定图例[距上方距离,距右方距离,距下方距离,距左方距离]
							},
							grid: {
								left: '3%',
								right: '4%',
								bottom: '4%',
								top: '8%',
								containLabel: true
							},
							xAxis: {
								type: 'value'
							},
							yAxis: {
								type: 'category',
								data: that.echart2Name.reverse(),//arr.reverse()将数组反转
							},
							series: [{
								name: '月度回款(万元)',
								type: 'bar',
								stack: 'total',
								label: {
									show: true,
									position: 'right'
								},
								itemStyle: {
									color: '#fac858'
								},
								emphasis: {
									focus: 'series'
								},
								data: that.echart2Data.reverse()
							}]
						})
						window.onresize = this.chart.resize; // 窗口或框架被调整大小时执行Echart.resize

						// 1、 在渲染点击事件之前先清除点击事件
						this.chart.off('click')
						// triggerEvent为true时,触发点击事件
						this.chart.on('click', function(params) {
							EchartData.forEach(item => {
								if (params.name == item.submitName && params.data == item.totalMoney) {
									if (!item.returnedMoneyRecordList) {
										item.returnedMoneyRecordList = []
									}
									uni.navigateTo({
										url: '/pages/tabbar/tabbar-1/workStatsDetail?returnedMoneyRecordList=' + JSON
											.stringify(item.returnedMoneyRecordList) + '&name=' + item.submitName
									})
								}
							})
						})
					} else {
						uni.showModal({
							content: res.data.msg,
							showCancel: false,
						})
					}
				})
			}
		},
	}
</script>


 1208
1208


 被折叠的 条评论
为什么被折叠?
被折叠的 条评论
为什么被折叠?
 到【灌水乐园】发言


