


 本文介绍了R语言grDevices工具包中的colors()、rgb()、col2rgb()和grey()等函数,展示了如何使用内置颜色、生成三原色配色、转换颜色格式以及创建灰度系列。通过实例演示了如何在图表中应用这些颜色功能。
前篇介绍的RColorBrewer包是R常用的配色拓展包,而R系统自带的配色方案则由grDevices工具包提供。
由于grDevices工具包中的配色函数较多,我们分多篇推文进行介绍,本篇介绍的函数有如下几个:
colors()
rgb()
col2rgb()
grey()
grey.colors()
2 grDevices工具包
colors()
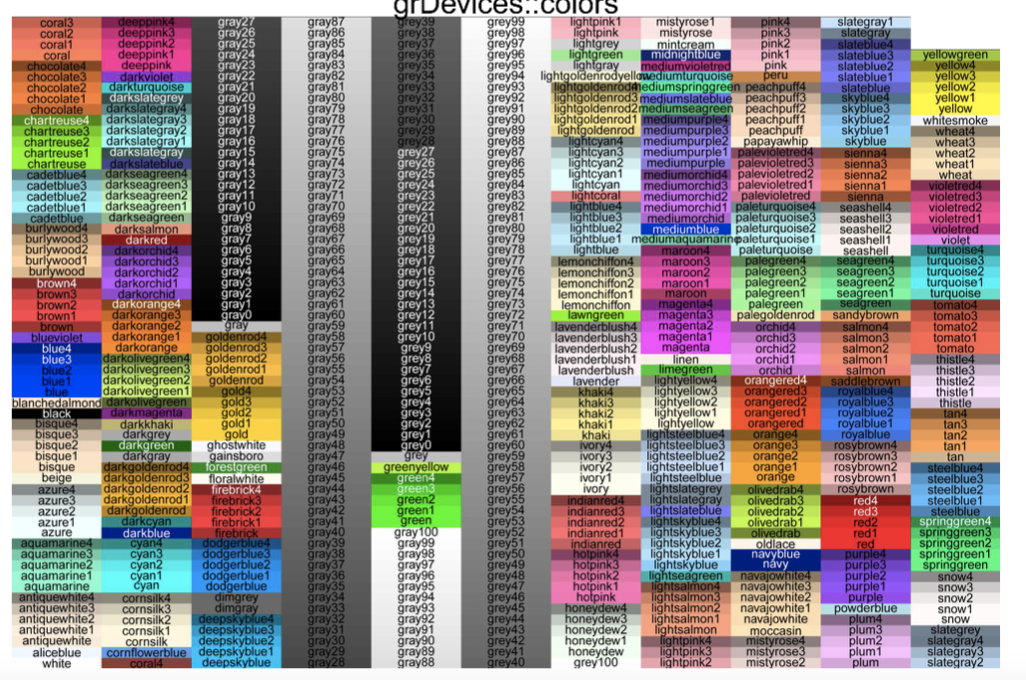
R系统中内置657种颜色,这些颜色在使用时直接调用颜色名称即可,如red、blue、green、lightblue、darkgreen、grey等。
使用colors()函数(或者colours()函数)可以查看所有内置颜色名称:
head(colors()) # 仅显示前6种
## [1] "white"         "aliceblue"     "antiquewhite"  "antiquewhite1"
## [5] "antiquewhite2" "antiquewhite3"
image(x = 1:3, y = 1,
      z = matrix(1:3, ncol = 1),
      col = c("blue", "white", "red"),
      axes = F, ann = F)
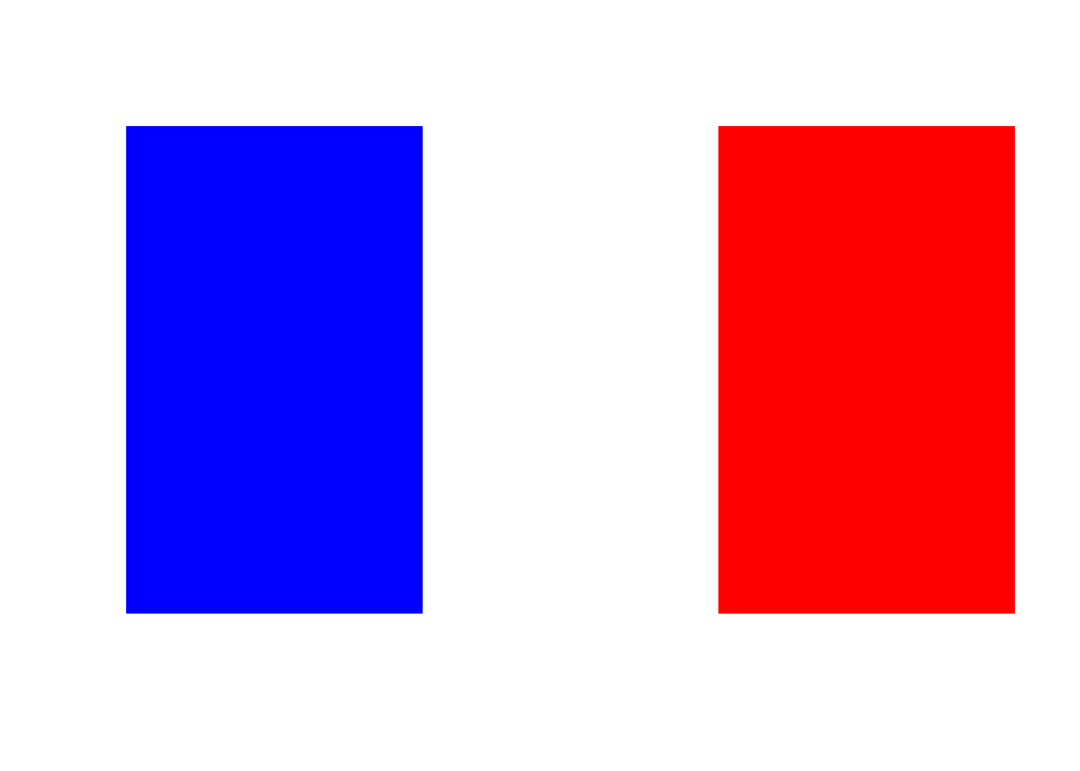
下图展示了内置颜色名称及其对应的效果:
rgb()
rgb()函数是根据三原色原理进行配色的,即大多数的颜色可以通过红、绿、蓝三色按照不同的比例合成产生;同样,绝大多数单色光也可以分解成红、绿、蓝三种色光,这是色度学的最基本的原理(来自百度百科)。
rgb()函数的语法结构如下:
rgb(red, green, blue,
    alpha, names = NULL,
    maxColorValue = 1)
red、green、blue:三原色参数;
alpha:半透明参数;数值越小,透明度越高;
names:对颜色进行命名,可省略;
maxColorValue:三原色参数和半透明参数的最大值,默认为1,即
red、green、blue、alpha四个参数的取值范围为0-1。
大部分调色软件对三原色的默认设置范围是[0, 255],即
maxColorValue = 255。
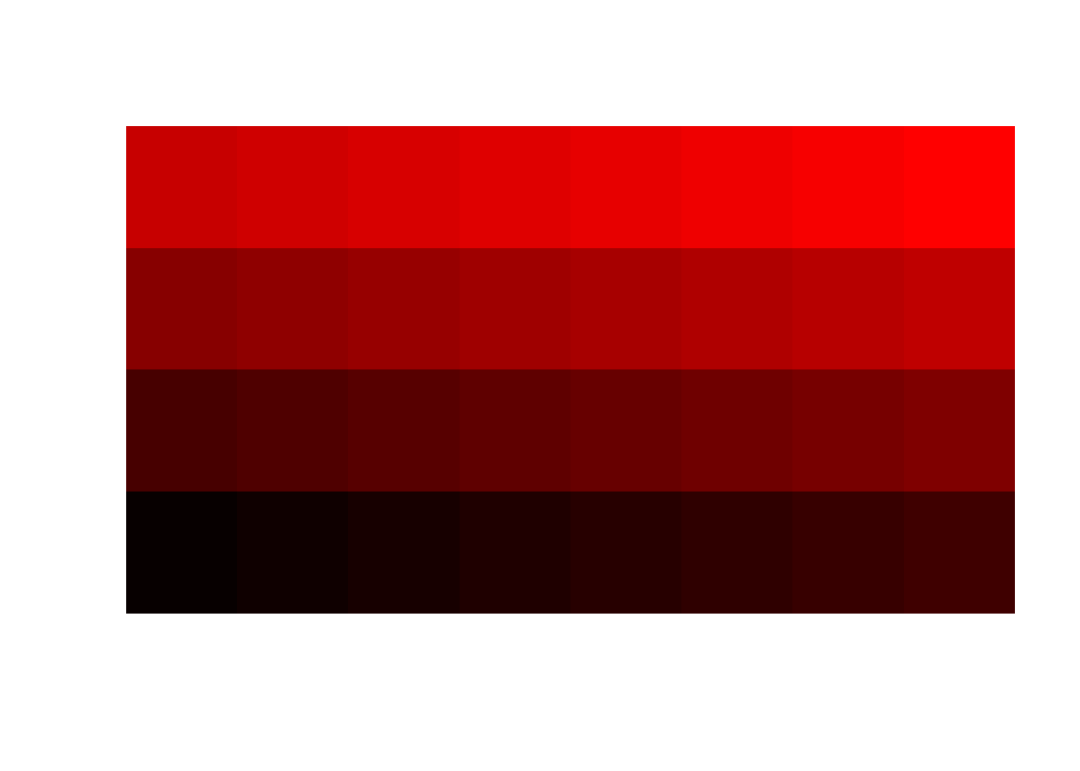
r <- seq(7, 255, 8)
col <- rgb(r, 0, 0, alpha = 255,
           maxColorValue = 255)
image(x = 1:8, y = 1:4,
      z = matrix(1:32, ncol = 4),
      col = col,
      axes = F, ann = F)
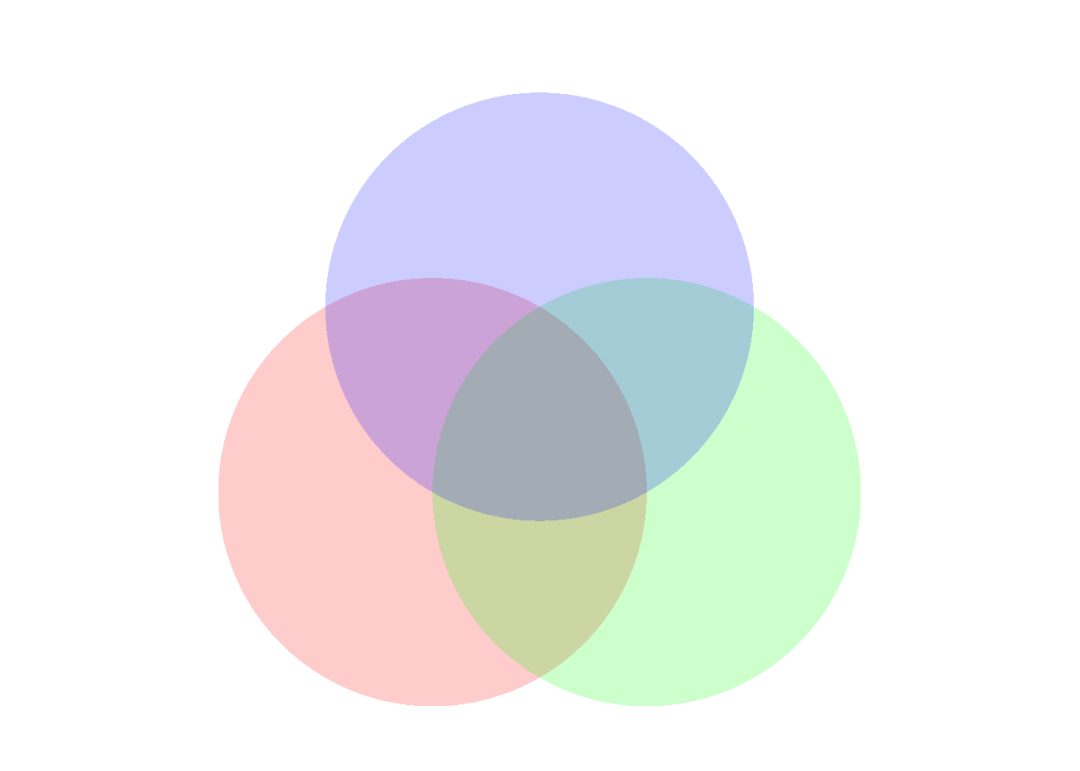
使用rgb()函数生成具有一定透明度的颜色,若颜色重叠还可以生成新的颜色,而内置颜色则会出现覆盖。
theta <- seq(0, 2*pi, 0.001)
x <- sin(theta)
y <- cos(theta)

par(plt = c(0.05, 0.95, 0.05, 0.95))
plot(1, type = "n", ann = F, axes = F,
     xlim = c(-1, 2), ylim = c(-1, 2),
     asp = 1)
polypath(x, y, col = rgb(1,0,0,0.2), border = NA)
polypath(x+1, y, col = rgb(0,1,0,0.2), border = NA)
polypath(x+0.5, y+0.866, col = rgb(0,0,1,0.2), border = NA)
由rgb()函数生成的颜色还可以使用十六进制表示,即分别将[0, 255]范围内的三原色参数和半透明参数依次转换成十六进制的表达形式(半透明参数可以省略),并在前面加上#,如红色的十六进制编码为#FF0000。
rgb(1,0,0,0.2)
## [1] "#FF000033"
许多网站都可以查询颜色的RGB编码和十六进制编码的对照表。
col2rgb()
通过col2rgb()函数,我们可以查询内置颜色的RGB编码,或将十六进制编码转换成RGB编码:
col2rgb(col, alpha = FALSE)
col:内置颜色名称或颜色的十六进制编码。
col2rgb("skyblue")
##       [,1]
## red    135
## green  206
## blue   235

col2rgb("#FF000033")
##       [,1]
## red    255
## green    0
## blue     0
grey()
使用rgb()函数生成的颜色在黑白打印时几乎无法辨别,针对这种情况,可以使用grey()函数(或 gray()函数)生成灰度颜色。语法结构如下:
grey(level, alpha = NULL)
level:灰度水平,取值在0-1之间;0表示黑色,1表示白色。
lev <- seq(0, 0.99, 0.2)
col <- grey(lev)
image(x = 1:5, y = 1,
      z = matrix(1:5, ncol = 1),
      col = col,
      axes = F, ann = F)

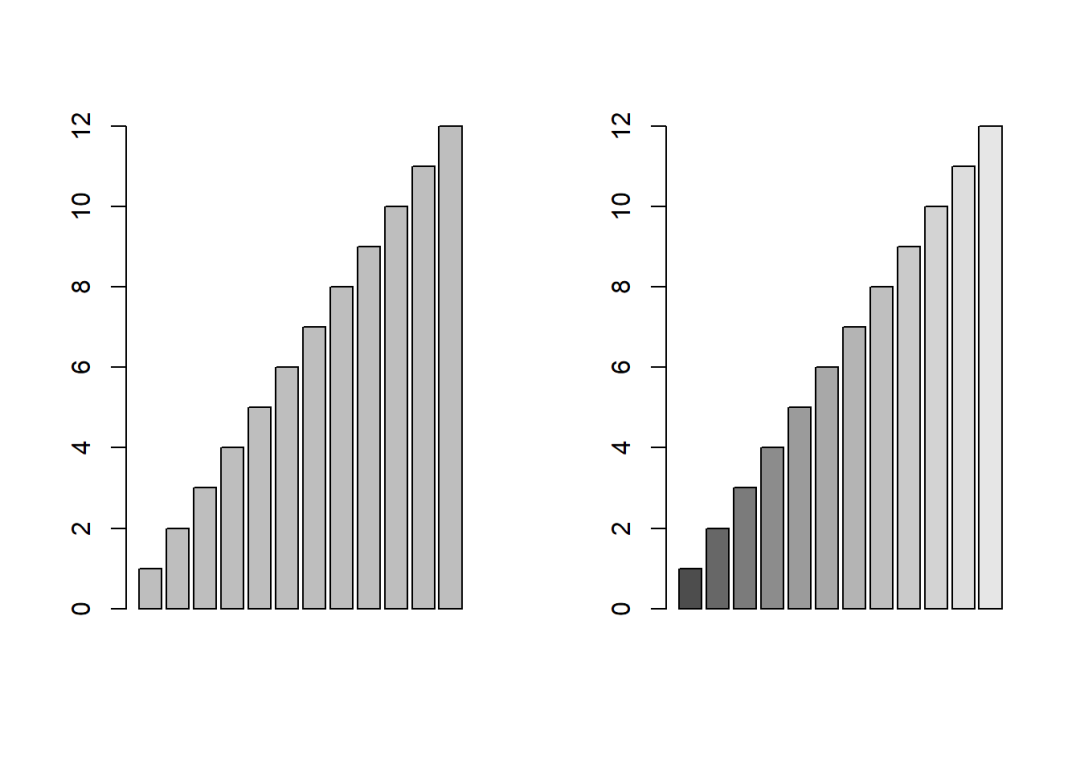
grey.colors()
grey.colors()函数的功能是快速生成一组连续水平的灰度颜色,语法结构如下:
gray.colors(n, start = 0.3, end = 0.9,
            gamma = 2.2, alpha = NULL,
            rev = FALSE)
n:颜色个数;
start、end:灰度水平的起始和终止值,同
grey()函数的level参数。
par(mfrow = c(1,2))
barplot(1:12)
barplot(1:12, col = gray.colors(12))


 1766
1766

 被折叠的 条评论
为什么被折叠?
被折叠的 条评论
为什么被折叠?
 到【灌水乐园】发言


