


#Timeline时间线包
from pyecharts.charts import Bar,Timeline
from pyecharts.options import *
from pyecharts.globals import ThemeType #设置主题
#创建图标
bar1=Bar()
bar1.add_xaxis([“中国”,“美国”,“英国”])
bar1.add_yaxis(“GDP”,[30,20,10],label_opts=LabelOpts(position=“right”))
bar2=Bar()
bar2.add_xaxis([“中国”,“美国”,“英国”])
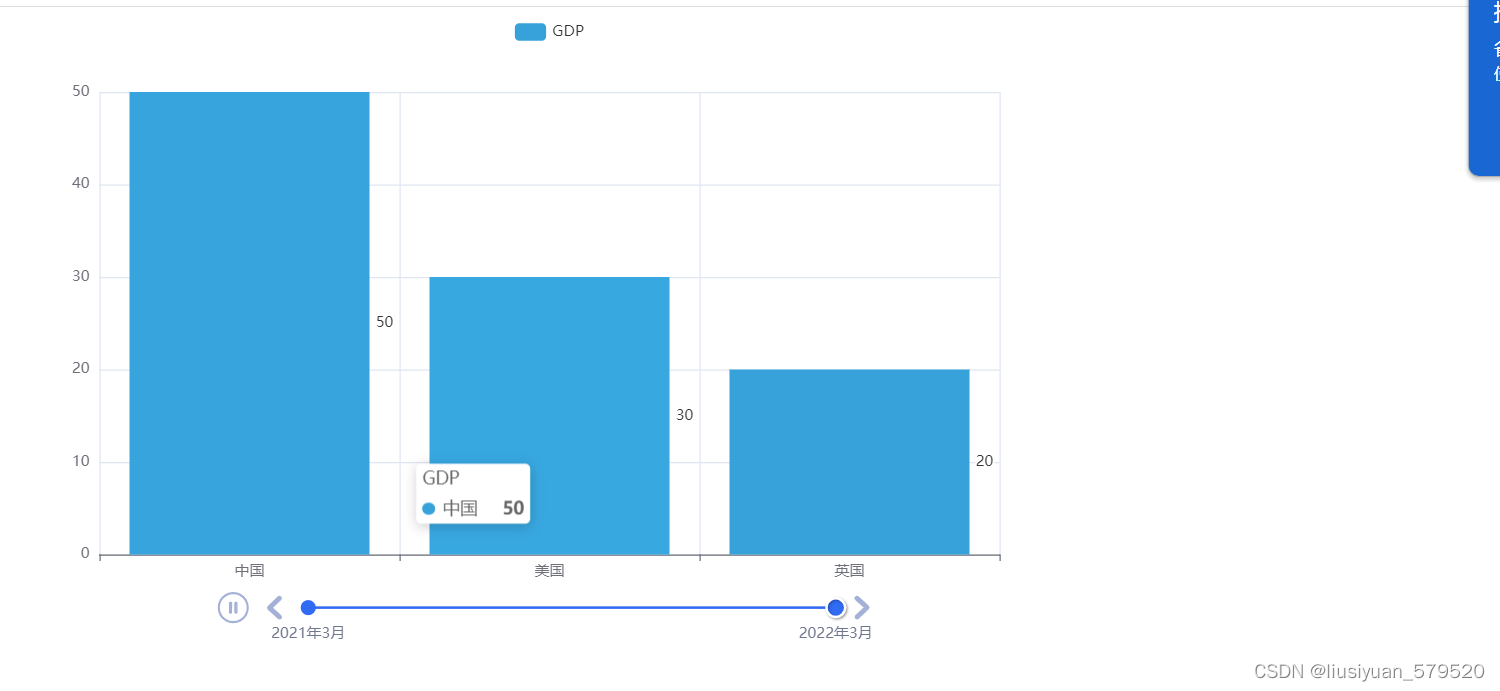
bar2.add_yaxis(“GDP”,[50,30,20],label_opts=LabelOpts(position=“right”))
#创建时间对象
timeline=Timeline({“theme”:ThemeType.LIGHT}) #设置主题
#在时间线内添加对象
timeline.add(bar1,“2021年3月”)
timeline.add(bar2,“2022年3月”)
#设置自动播放
timeline.add_schema(
play_interval=1000, #自动播放速度,单位毫秒
is_timeline_show=True, #是否显示时间线
is_auto_play=True, #是否自动播放
is_loop_play=True, #是否循环播放
)
#全局设置
timeline.render(“时间线柱状图.html”)
结果:


 1194
1194


 被折叠的 条评论
为什么被折叠?
被折叠的 条评论
为什么被折叠?
 到【灌水乐园】发言


