


项目简介与搭建过程
项目简介
需求背景
信贷管理系统是一种用于银行、金融机构或其他借贷组织用于管理信贷流程的软件系统。它可以帮助机构管理贷款申请、贷款审批、合同管理等相关流程,提高信贷业务的效率和准确性。
需求描述
本需求文档旨在定义信贷管理系统的功能和特性,以满足机构对于信贷业务管理的需求。
信贷管理系统项目基于vue2实现,鉴于vue2的语法已经停止维护,后期会考虑使用vue3重写本项目
搭建过程
新建项目命令
vue create credit-management-system
项目配置语言选择
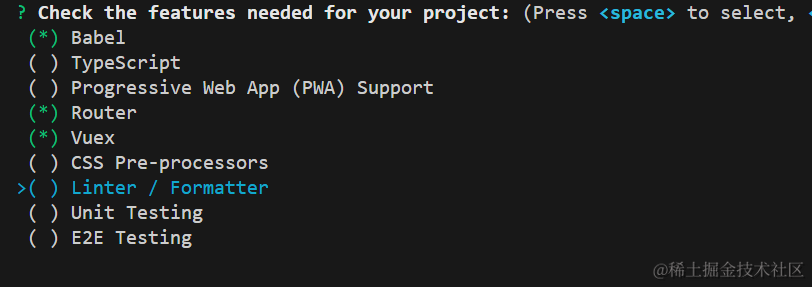
项目启动
npm run serve
登录页面初始化及其vue-router路由编写
配置路由
- 先把app.vue的默认代码删除,留下一个router-view路由出口
App.vue
<template>
  <div id="app">
    <router-view/>
  </div>
</template>
- 打开router文件夹下的index.js,删除掉默认的路由配置
Vue.use(VueRouter)

const routes = [

]

const router = new VueRouter({
  routes
})

export default router
- 在main.js里引入公共样式文件,导入和使用elementui组件
引入elementui组件
cnpm i element-ui -S
导入使用
import App from './App.vue'
import ElementUI from 'element-ui'
import 'element-ui/lib/theme-chalk/index.css'

Vue.use(ElementUI)
- 先在router文件夹下index.js添加一个登录页面的路由和重定向
组件是使用的懒加载,可以减少页面加载时间
const routes = [
    {
    path:'/',
    redirect:'/login'
  },
  {
    path: '/login',
    name: 'Login',
    component: () => import('../views/Login.vue')
  },
]
LoginView.vue写css之后报错不能解析sass-loader
在命令行执行如下命令
npm install sass-loader -D
cnpm install node-sass -D
引入公共样式normalize.css文件之后出现错误
错误信息:
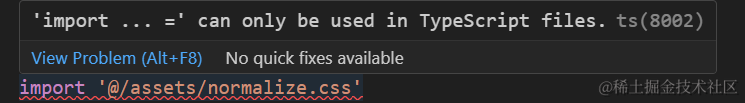
解决方案:ctrl+shift+p,在setting.json中添加如下
“javascript.validate.enable”: false
编写登录页面
第一步
<div class="login-box">
    <div class="login-input-box center">
      <h1>信贷管理系统</h1>

    </div>
  </div>
第二步
先定义表单内容放到–上面的h1标签下面
<el-form :model="ruleForm" :rules="rules" status-icon ref="ruleForm" class="demo-ruleForm">

        <el-form-item prop="username">
          <el-input prefix-icon="el-icon-user-solid" v-model="ruleForm.username"></el-input>
        </el-form-item>

        <el-form-item prop="pass">
          <el-input prefix-icon="el-icon-s-order" type="password" v-model="ruleForm.pass" autocomplete="off"></el-input>
        </el-form-item>

        <el-button type="primary" @click="submitForm">提交</el-button>
      </el-form>
第三步
1.data中定义一个ruleForm,接收用户名和密码
2.再定义一个rules,限制输入格式
3.在methods中添加一个submitForm表单提交方法和密码限制的validatePass方法
data中:
ruleForm: {

            username: "",
            pass: ""
          }
rules: {

        pass: [
          {

            validator: this.validatePass,
            trigger: "blur"
          }
        ],
        username: [{
    required: true, trigger: "blur", message: "请输入用户名" }]
      }
methods中:
validatePass(rule, value, callback) {

      if (value === "") {

        callback(new Error("请输入密码"));
      } else if (value.length < 6) {

        callback(new Error("密码不能小于6位数"));
      } else {

        callback();
      }
    },
 submitForm(){

 this.$refs.ruleForm.validate(valid => {

        if (valid) {

          // 如果验证通过,
         //调用login方法,传入登录信息,下面会定义
         this.login(this.ruleForm)
        } else {


          return false;
        }
      });
  }
4.创建login登录方法
async login(form){

    //成功后跳转到首页
     this.$router.replace("/home");
}
5.样式的引入
在main.js中引入样式
import '@/assets/normalize.css';
6.在登录界面中引入下面样式
!!!注意语言是scss
<style lang="scss" scoped>
.login-input-box {

  width: 650px;
  height: 320px;
  background: #fff;
  text-align: center;
  padding: 40px 40px 12px 12px;
}

.login-box {

  height: 100%;
  background: url(../assets/bg2.jpg);
  background-size: cover;
}

.el-button {

  width: 600px;
}

.el-input {

  width: 600px;
  margin-bottom: 16px;
}

::v-deep .el-input__inner {

  background: #e5e5e5;
}
</style>
编写首页
添加路由规则
打开router文件夹下的index.js
其中的Layout为布局页面
//为routes添加
{
    path: '/',
    redirect:'/home',
        //下面这两个页面按照层级自行创建
    component:()=>  import('@/layout/layout.vue'),
    children:[
      {
      meta:{
       title:'首页'
        },
        path:'/home',
        component:()=> import('@/views/home.vue')
      }
    ]
  }
layout布局和编写首页及其vue-router路由跳转
layout布局包括侧边栏,导航栏和内容部分
 <div>
    <el-container>
     <el-aside width="240px">
        <el-menu   class="el-menu-vertical-demo" background-color="#545c64"
            text-color="#fff" active-text-color="#ffd04b">
            <!--//没有二级导航的 -->
             <el-menu-item index="1">
                <span slot="title"> 首页</span>
             </el-menu-item>

    	 <!--	//有二级导航的 -->
            <el-submenu index="2">
                    <template slot="title">
                    <span>贷款管理</span>
                    </template>
                  <el-menu-item index="2-1">
                     贷款申请
                  </el-menu-item>
            </el-submenu>
        </el-menu>
    </el-aside>
        <el-container>
            <el-header>
               <!--//左侧面包屑-->
               <div class="left">
                   首页
                </div>
         		<!--//右侧用户名-->
                <div class="right">
                   <!--// //下拉菜单-->
                   <el-dropdown >

                    <span class="el-dropdown-link"> admin </span>

                    <el-dropdown-menu slot="dropdown">
                         <el-dropdown-item >退出登录</el-dropdown-item>
                    </el-dropdown-menu>

                  </el-dropdown>
                </div>
            </el-header>
            <el-main>
                <!-- //放置一个路由出口 -->
                <router-view />
            </el-main>
        </el-container>
    </el-container>
  </div>
侧边栏包含二级菜单,导航栏最右侧有一个退出登录选择,内容包括了数字滚动和echarts图表
数字滚动组件vue-count-to
官网:https://www.npmjs.com/package/vue-count-to
安装插件的命令如下
npm i -S vue-count-to@1.0.13
引入后插入页面使用,在使用命令安装过程中出现如下报错信息
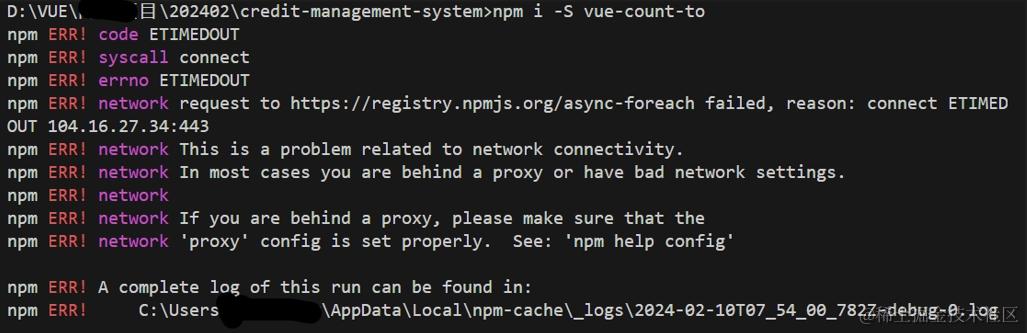
解决方案:
根据提示检查网络情况,更换手机热点(我开发过程中更换热点仍然报错,应该不是网络原因了)
修改npm的网络设置 npm config list

图中设置用到的命令如下
npm config set proxy null
npm config set https-proxy null
npm config set registry https://registry.npmjs.org/
最初查阅文档之类的设置了很多次,最后有点懵懵哒,npm init了
稍过一会,再次下载就ok了(也许是设置原因或者最初网络不佳,不是非常确定)
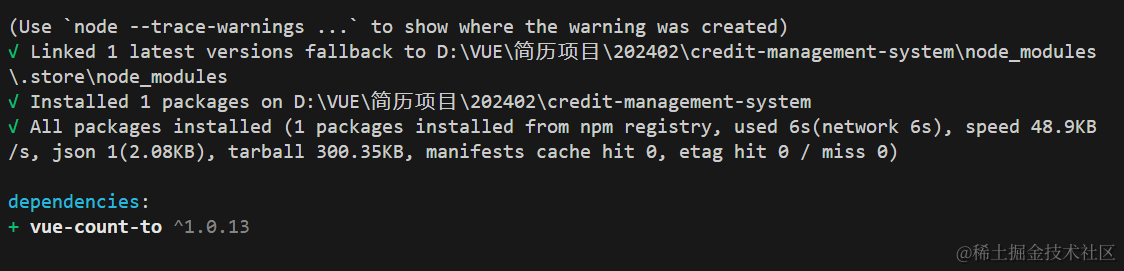
最后一次成功使用的命令是
cnpm i -S vue-count-to@1.0.13
( npm是node官方的包管理器。 cnpm是个中国版的npm,是淘宝定制的 cnpm (gzip 压缩支持) 命令行工具代替默认的 npm)
首先设置3个栅格布局,其中属性作用,查看element-ui官网的layout布局
 <div class="home">
    <el-row :gutter="10">
            <el-col :xl="6" :lg="6" :md="12" :sm="24" :xs="24" >
            <div>1</div>
            </el-col>
            <el-col :xl="6" :lg="6" :md="12" :sm="24" :xs="24" >
            <div>2</div>
            </el-col>
            <el-col :xl="6" :lg="6" :md="12" :sm="24" :xs="24" >
            <div>3</div>
        </el-col>
    </el-row>
</div>
把栅格布局的内容使用数组遍历来显示
<el-row :gutter="10">
        <el-col :xl="6" :lg="6" :md="12" :sm="24" :xs="24" v-for="(item, index) in list"          :key="index">

          <div class="dashboard-item" :style="{ background: item.color }">
            <p>{
  { item.title }}</p>

          </div>
        </el-col>
</el-row>
data中定义一个数组
 data(){
        return {
            list: [
                { val: 13594, title: '最高可借金额', color: '#67ca3a', },
                { val: 9833, title: '回报率', color: '#ff6600' },
                { val: 8888, title: '业绩领跑', color: '#f56c6c' },
                { val: 6666, title: '安稳底薪战队', color: '#409eff' }
             ]
        }
    }
echarts图表
介绍echart
官网https://echarts.apache.org/zh/index.html
下载echarts并使用
- 下载
cnpm i -S echarts@4.9.0
- HomeViews页面引入
import echarts from 'echarts';
编写第一个图表
- 定义图表位置
<template>
    <div class="home">
     <el-row :gutter="10">
          <el-col :xl="6" :lg="6" :md="12" :sm="24" :xs="24" v-for="(item, index) in             list"  :key="index">

            <div class="dashboard-item" :style="{ background: item.color }">
              <p>{
  { item.title }}</p>
              <CountTo :startVal="0" :endVal="item.val" :duration="3000" />
            </div>
          </el-col>
        </el-row>

		<!-- 所有图表位置,一共3个 -->
    <div class="echarts-box">
        <!-- 第一个图表位置-->
      <div class="chart1"></div>

    </div>


    </div>
  </template>
- 配置图表
添加一个initCharts方法
 initCharts() {
     //初始化图表实例,为什么要添加到this上面,因为后面要检测页面大小改变,更新图表大小
      this.chart1 = echarts.init(document.querySelector('.chart1'));
     //图表配置
     let option1 = {
        title: {

        },
        tooltip: {
          trigger: 'axis'
        },
        legend: {
          data: ['Email', 'Union Ads', 'Video Ads', 'Direct', 'Search Engine']
        },
        grid: {
          left: '3%',
          right: '4%',
          bottom: '3%',
          containLabel: true
        },
        toolbox: {
          feature: {
            saveAsImage: {}
          }
        },
        xAxis: {
          type: 'category',
          boundaryGap: false,
          data: ['Mon', 'Tue', 'Wed', 'Thu', 'Fri', 'Sat', 'Sun']
        },
        yAxis: {
          type: 'value'
        },
        series: [
          {
            name: 'Email',
            type: 'line',
            stack: 'Total',
            data: [120, 132, 101, 134, 90, 230, 210]
          },
          {
            name: 'Union Ads',
            type: 'line',
            stack: 'Total',
            data: [220, 182, 191, 234, 290, 330, 310]
          },
          {
            name: 'Video Ads',
            type: 'line',
            stack: 'Total',
            data: [150, 232, 201, 154, 190, 330, 410]
          },
          {
            name: 'Direct',
            type: 'line',
            stack: 'Total',
            data: [320, 332, 301, 334, 390, 330, 320]
          },
          {
            name: 'Search Engine',
            type: 'line',
            stack: 'Total',
            data: [820, 932, 901, 934, 1290, 1330, 1320]
          }
        ]
      }

     //应用配置生成图表
      this.chart1.setOption(option1)
 }
- 在mounted生命周期里执行initCharts方法
mounted() {
    this.initCharts()
 }
- 图表没有显示
需要设置容器大小
 .chart1 {

    width: 100%;
    height: 400px;
  }
编写第二个图表
	<!-- 放在第一个图表下面     -->
<div class="chart2"></div>
- 在initCharts方法中编写第二个图表数据
     this.chart2 = echarts.init(document.querySelector('.chart2'));
		//下面都是图表的配置,顺序不能错

      let posList = [
        'left',
        'right',
        'top',
        'bottom',
        'inside',
        'insideTop',
        'insideLeft',
        'insideRight',
        'insideBottom',
        'insideTopLeft',
        'insideTopRight',
        'insideBottomLeft',
        'insideBottomRight'
      ];
      let app = {
   };

      app.configParameters = {

        rotate: {

          min: -90,
          max: 90
        },
        align: {

          options: {

            left: 'left',
            center: 'center',
            right: 'right'
          }
        },
        verticalAlign: {

          options: {

            top: 'top',
            middle: 'middle',
            bottom: 'bottom'
          }
        },
        position: {

          options: posList.reduce(function (map, pos) {

            map[pos] = pos;
            return map;
          }, {
   })
        },
        distance: {

          min: 0,
          max: 100
        }
      };
      app.config = {

        rotate: 90,
        align: 'left',
        verticalAlign: 'middle',
        position: 'insideBottom',
        distance: 15,
        onChange: function () {

          const labelOption = {

            rotate: app.config.rotate,
            align: app.config.align,
            verticalAlign: app.config.verticalAlign,
            position: app.config.position,
            distance: app.config.distance
          };
          this.chart2.setOption({

            series: [
              {

                label: labelOption
              },
              {

                label: labelOption
              },
              {

                label: labelOption
              },
              {

                label: labelOption
              }
            ]
          });
        }
      };
      const labelOption = {

        show: true,
        position: app.config.position,
        distance: app.config.distance,
        align: app.config.align,
        verticalAlign: app.config.verticalAlign,
        rotate: app.config.rotate,
        formatter: '{c}  {name|{a}}',
        fontSize: 16,
        rich: {

          name: {
   }
        }
      };
      let option2 = {

        tooltip: {

          trigger: 'axis',
          axisPointer: {

            type: 'shadow'
          }
        },
        legend: {

          data: ['Forest', 'Steppe', 'Desert', 'Wetland']
        },
        toolbox: {

          show: true,
          orient: 'vertical',
          left: 'right',
          top: 'center',
          feature: {

            mark: {
    show: true },
            dataView: {
    show: true, readOnly: false },
            magicType: {
    show: true, type: ['line', 'bar', 'stack'] },
            restore: {
    show: true },
            saveAsImage: {
    show: true }
          }
        },
        xAxis: [
          {

            type: 'category',
            axisTick: {
    show: false },
            data: ['2012', '2013', '2014', '2015', '2016']
          }
        ],
        yAxis: [
          {

            type: 'value'
          }
        ],
        series: [
          {

            name: 'Forest',
            type: 'bar',
            barGap: 0,
            label: labelOption,
            emphasis: {

              focus: 'series'
            },
            data: [320, 332, 301, 334, 390]
          },
          {

            name: 'Steppe',
            type: 'bar',
            label: labelOption,
            emphasis: {

              focus: 'series'
            },
            data: [220, 182, 191, 234, 290]
          },
          {

            name: 'Desert',
            type: 'bar',
            label: labelOption,
            emphasis: {

              focus: 'series'
            },
            data: [150, 232, 201, 154, 190]
          },
          {

            name: 'Wetland',
            type: 'bar',
            label: labelOption,
            emphasis: {

              focus: 'series'
            },
            data: [98, 77, 101, 99, 40]
          }
        ]
      };

      this.chart2.setOption(option2);
- 设置第二个图表的容器大小
.chart2 {
    height: 400px;
    width: 50%;
  }
编写第三个图表
      <!--放到第二个图表下面 -->
<div class="chart3"></div>
- 配置第三个图表信息
      this.chart3 = echarts.init(document.querySelector('.chart3'));
    let option3  = {

        angleAxis: {
   },
        radiusAxis: {

          type: 'category',
          data: ['Mon', 'Tue', 'Wed', 'Thu'],
          z: 10
        },
        polar: {
   },
        series: [
          {

            type: 'bar',
            data: [1, 2, 3, 4],
            coordinateSystem: 'polar',
            name: 'A',
            stack: 'a',
            emphasis: {

              focus: 'series'
            }
          },
          {

            type: 'bar',
            data: [2, 4, 6, 8],
            coordinateSystem: 'polar',
            name: 'B',
            stack: 'a',
            emphasis: {

              focus: 'series'
            }
          },
          {

            type: 'bar',
            data: [1, 2, 3, 4],
            coordinateSystem: 'polar',
            name: 'C'
最低0.47元/天 解锁文章


 3178
3178


 被折叠的 条评论
为什么被折叠?
被折叠的 条评论
为什么被折叠?
 到【灌水乐园】发言


