


annotate函数基本用法
library(ggplot2)
library(cowplot)
#annotate用法
#annotate()通过第一个参数指定标注类型:
#"text","rect","segment","pointrange","curve"
p <- ggplot(data.frame())+geom_point()+xlim(0,10)+ylim(0,10)
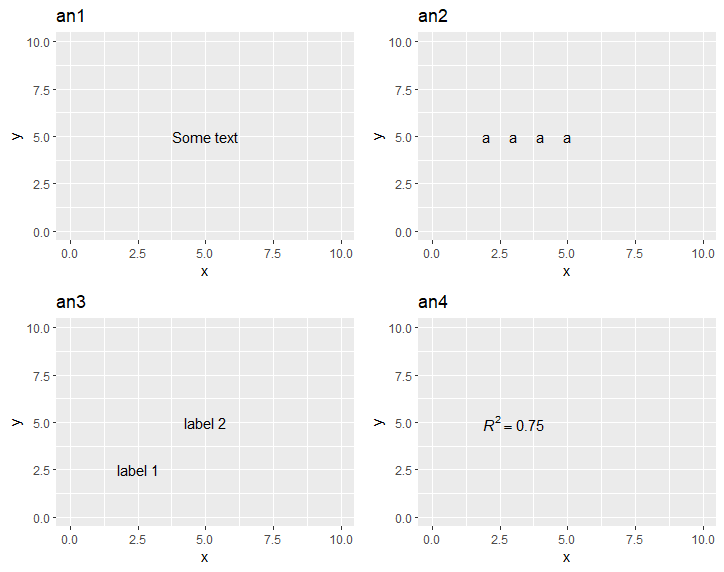
#text 添加文本
#在(5,5)处添加标签some text
an1 <- p + annotate("text", x = 5, y = 5, label = "Some text")+
ggtitle("an1")
an1
#在y=5直线上x从2到5每间隔一个单位添加标签some text
an2 <- p + annotate("text", x = 2:5, y = 5, label = "a")+
ggtitle("an2")
an2
#在(2.5,2.5)和(5,5)处添加注释
an3 <- p + annotate("text", x = c(2.5,5), y = c(2.5,5), label = c("label 1", "label 2"))+
ggtitle("an3")
an3
#数学公式 详见文末
an4 <- p + annotate("text", x = 3, y = 5, label = "italic(R) ^ 2 == 0.75",
parse = TRUE)+
ggtitle("an4")
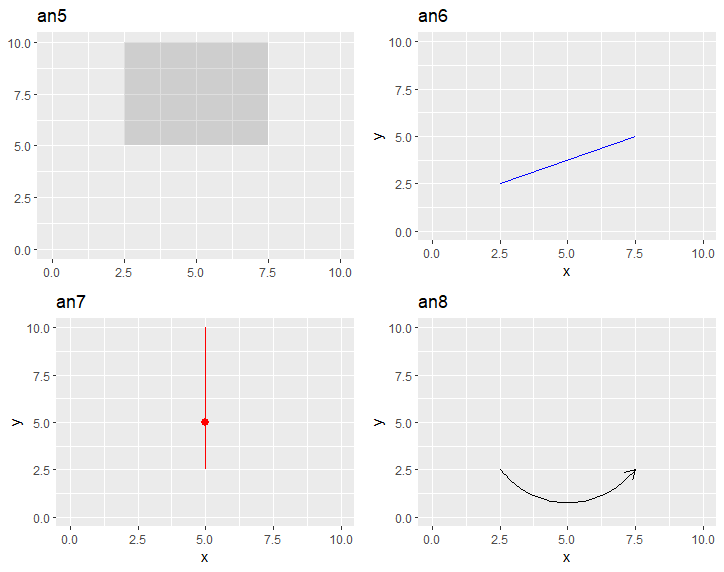
#rect阴影
#在这片区域作阴影,透明度为0.2
an5 <- p + annotate("rect",
xmin = 2.5, xmax = 7.5,#x范围
ymin = 5, ymax = 10,#y范围
alpha = .2)+
ggtitle("an5")
an5
#segment直线
#以(2.5,2.5)为起点,(7.5,5)为终点作直线
an6 <- p + annotate("segment", x = 2.5, xend = 7.5, y = 2.5, yend = 5,
colour = "blue")+
ggtitle("an6")
an6
#pointrange如图
an7 <- p + annotate("pointrange",
x = 5, y = 5,#红点位置
ymin = 2.5, ymax = 10,
colour = "red", size = .5)+
ggtitle("an7")
an7
#curve添加有向箭头
an8 <- p + annotate("curve",
x = 2.5, y = 2.5,xend = 7.5, yend = 2.5,#起始点
curvature = .5,#弧度 加负号试试
arrow = arrow(length = unit(3, "mm")))+#箭头3mm
ggtitle("an8")
cowplot::plot_grid(an1,an2,an3,an4,nrow = 2)
cowplot::plot_grid(an5,an6,an7,an8,nrow = 2)效果
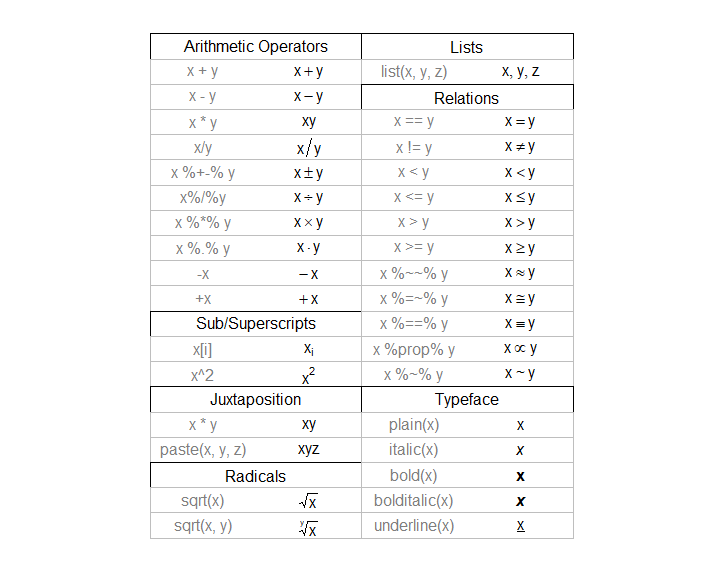
如何添加数学公式
添加数学公式 需要加上parse=TRUE
#添加数学公式 需要加上parse=TRUE
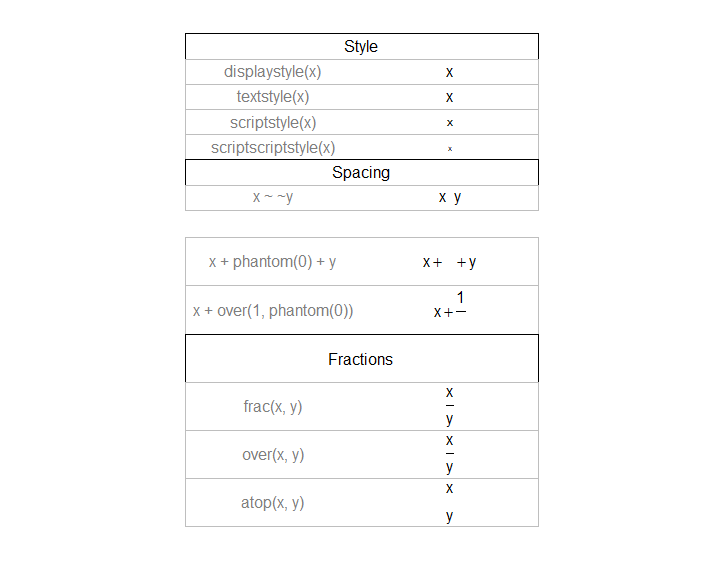
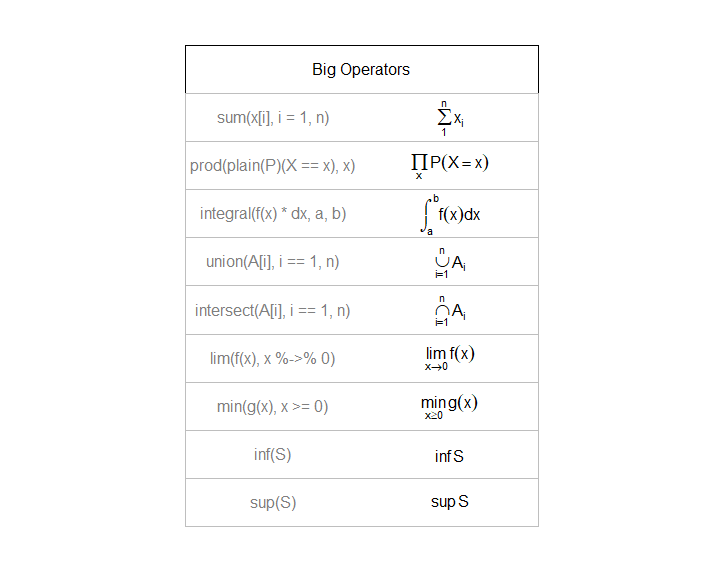
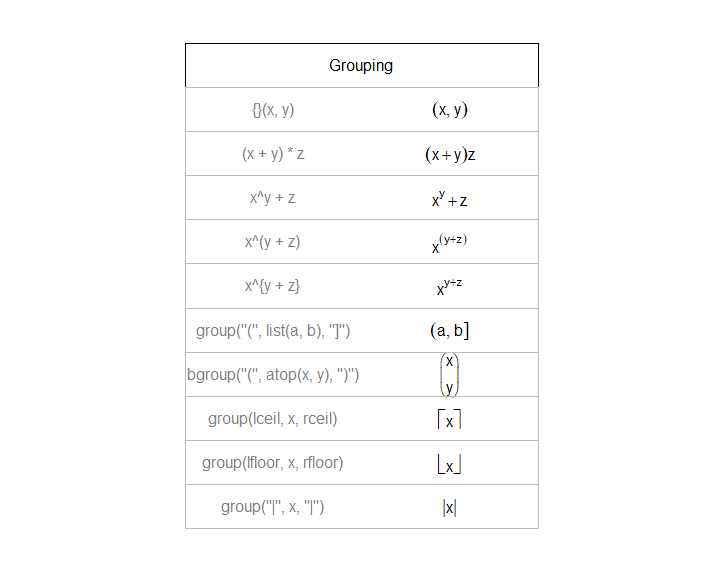
#首先了解数学公式的基本语法
demo(plotmath)#回车查看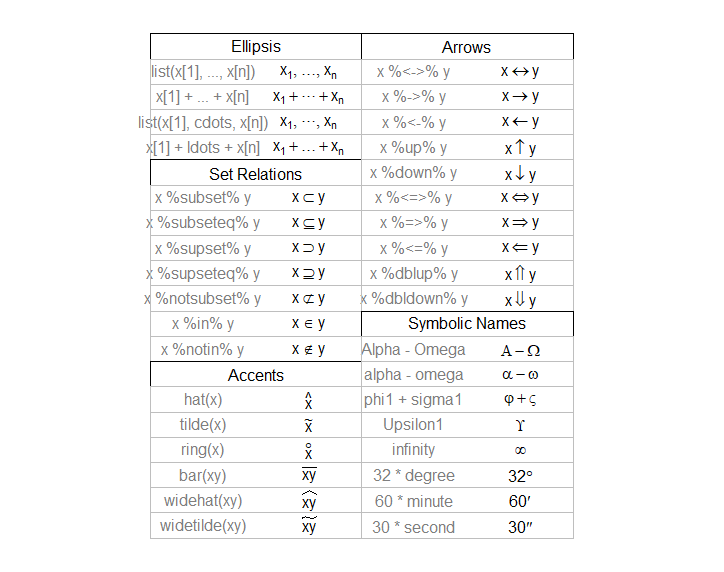
示例
p <- ggplot(data.frame())+geom_point()+xlim(0,10)+ylim(0,10)
p + annotate("text",x=2.5,y=5,
parse=TRUE,size=5,
label="y==frac(1,sqrt(2*pi))*e^{-x^2/2}")
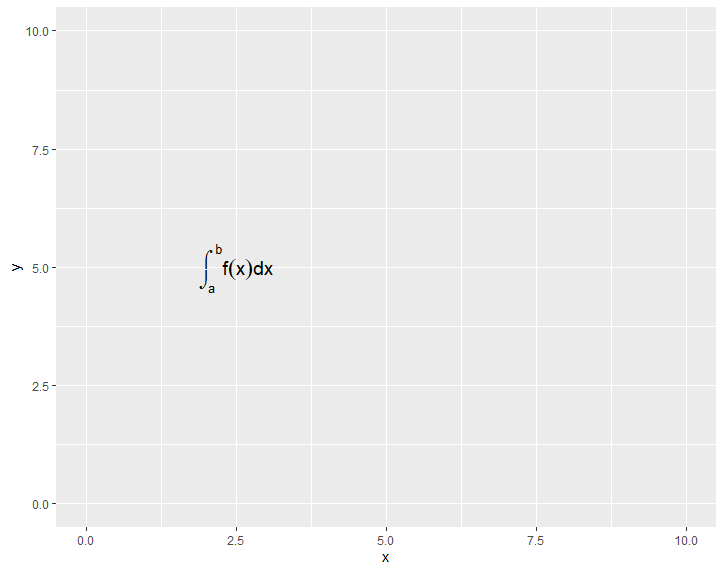
p + annotate("text",x=2.5,y=5,
parse=TRUE,size=5,
label="integral(f(x)*dx,a,b)")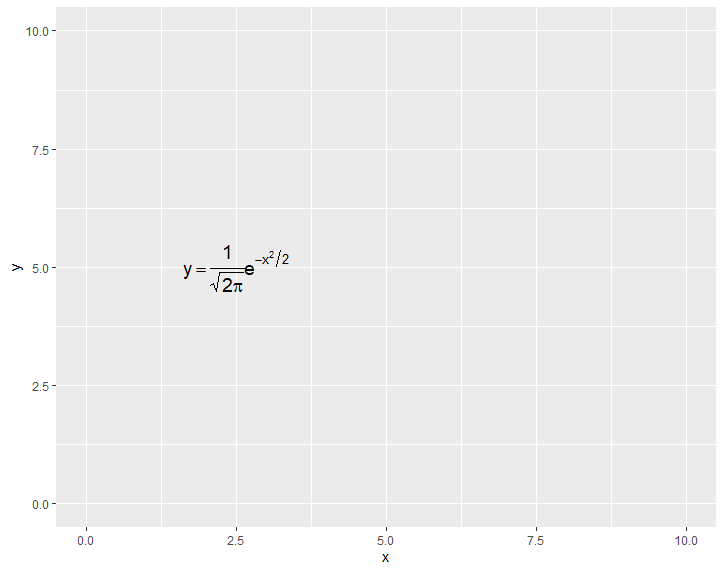


 1611
1611

 被折叠的 条评论
为什么被折叠?
被折叠的 条评论
为什么被折叠?
 到【灌水乐园】发言


