


电信客户流失分析-流失率预测(神经网络)
文章目录
前言
该文章使对本学期人工智能课程设计的总结(2023年 6 月30日)
给定数据集《电信客户流失分析.xlsx》进行描述性统计,对电信客户流失进行分析。
数据集《电信客户流失分析.xlsx》各字段说明如下:
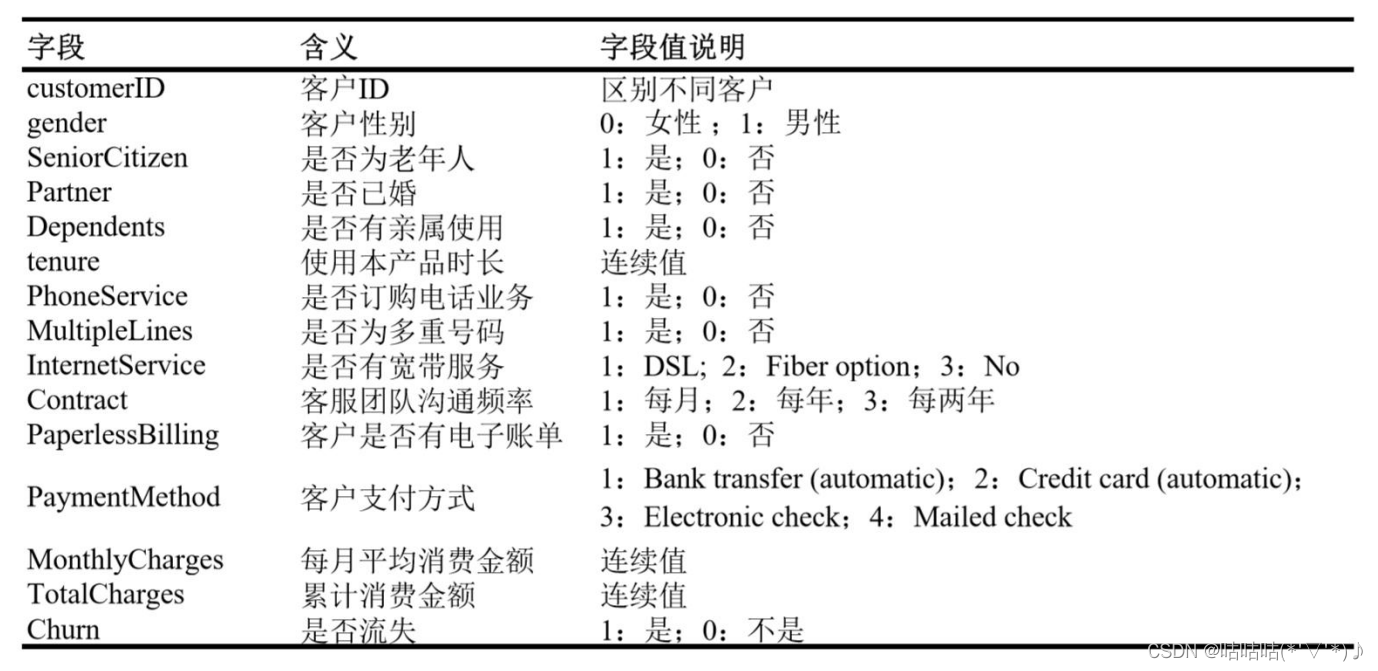
一、了解数据
1.数据预览
import pandas as pd
import numpy as np
df = pd.read_excel('电信客户流失分析.xlsx')
df.head(5)
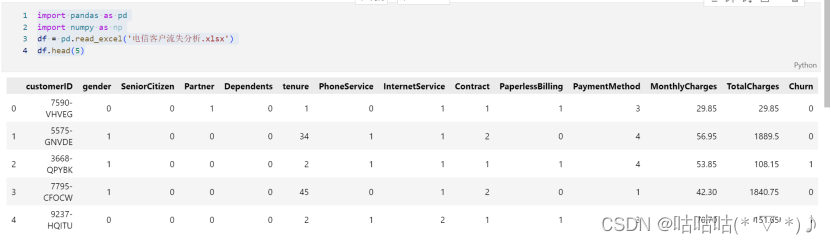
以上可以看到数据集的部分内容,从而把握整体属性的构成。
df.info() #查看索引、数据类型和内存信息
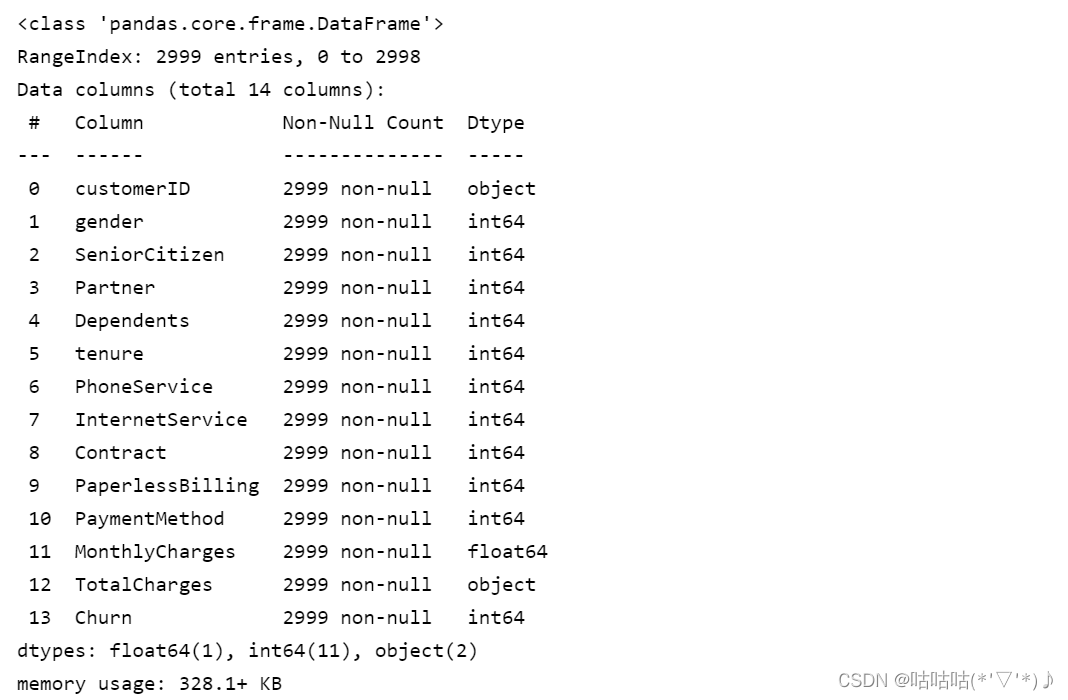
以上可以看到数据的属性信息,可以看见有2999行,14列(属性),以及每列元素数量,每列是否有缺失值(此处无缺失值),以及每列存储的数据类型。其中,知道数据类型对于后续的操作起到一定的参考作用。
df.nunique() #查看不同值
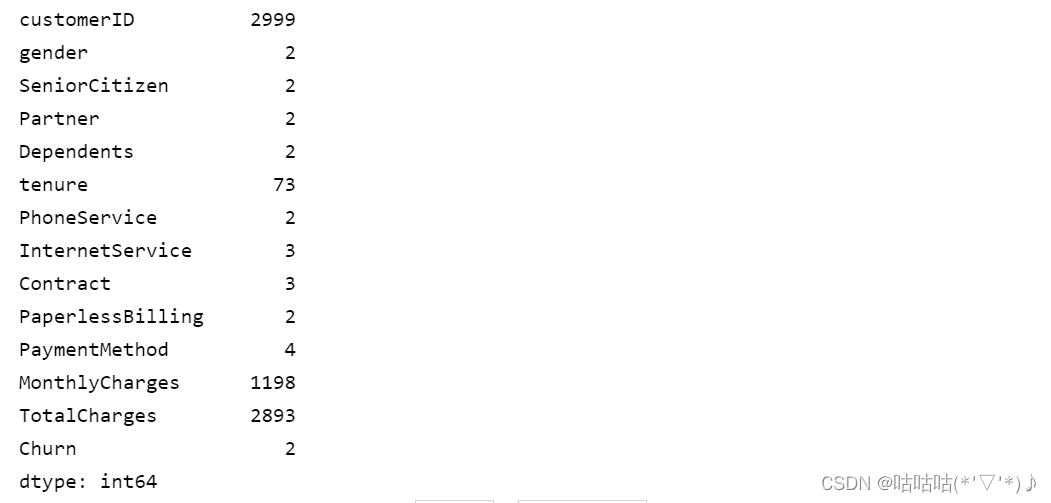
以上可以看到每列中有多少个不同的值。
df.describe() #查看数值型列的汇总统计
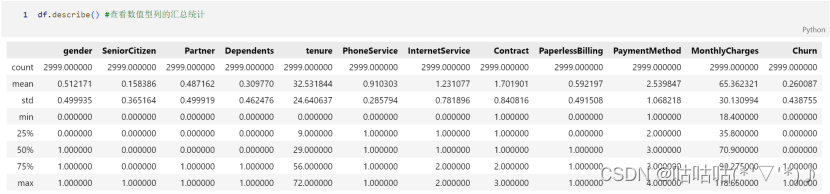
2.数据流失率情况
import pandas as pd
import matplotlib.pyplot as plt

df = pd.read_excel('电信客户流失分析.xlsx')

# 统计流失客户数量
churn_count = df['Churn'].sum()

# 计算整体流失率
total_customers = len(df)
churn_rate = churn_count / total_customers

# 绘制饼图
labels = ['Churn', 'Not Churn']
sizes = [churn_rate, 1 - churn_rate]
colors = ['#ff9999', '#66b3ff']
plt.pie(sizes, labels=labels, colors=colors, autopct='%1.1f%%', startangle=90)
plt.axis('equal')
plt.title('Churn Rate')
plt.show()
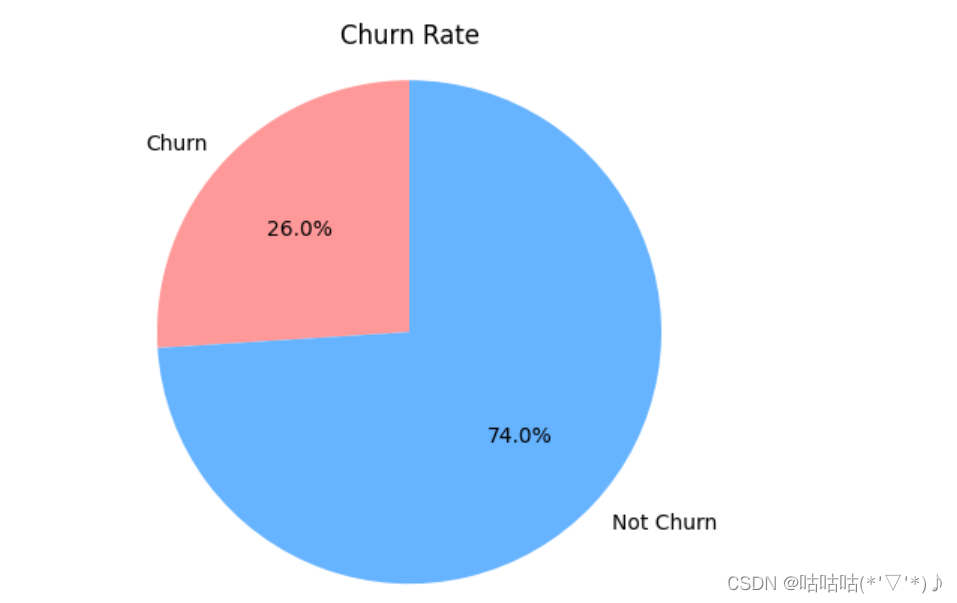
以上展现了数据集中Churn=1的部分所占的比例,并绘制饼图,体现整体流失率。
import pandas as pd

# 读取数据
data = pd.read_excel('电信客户流失分析.xlsx')

# 计算流失数量
total_churned = data[data['Churn'] == 1]['Churn'].count()

# 创建字典存储每个属性的最大流失率和对应的取值
max_churn_rate_by_attribute = {}

# 遍历每个属性
attributes = ['gender', 'SeniorCitizen', 'Partner', 'Dependents', 'tenure', 'PhoneService',
              'InternetService', 'Contract', 'PaperlessBilling', 'PaymentMethod']

for attribute in attributes:
    # 按照属性分组并计算流失对应属性数量
    churned_by_attribute = data[data['Churn'] == 1].groupby(attribute)['Churn'].count()

    # 计算流失率
    churn_rate = churned_by_attribute / total_churned

    # 找到最大流失率对应的取值
    max_churn_value = churn_rate.idxmax()

    # 将最大流失率和对应的取值存入字典
    max_churn_rate_by_attribute[attribute] = (max_churn_value, churn_rate[max_churn_value])

# 打印每个属性最大流失率对应的值(流失率)
for attribute, (value, churn_rate) in max_churn_rate_by_attribute.items():
    print(f"{attribute} 最大流失率对应的值:{value},流失率:{churn_rate:.4f}")
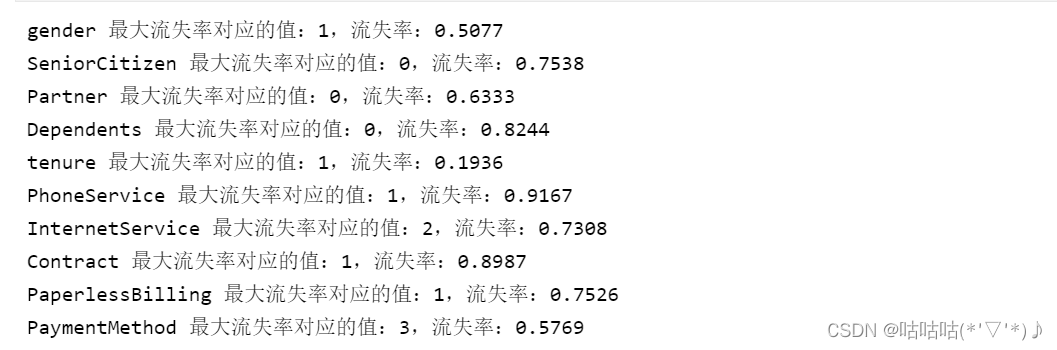
以上以单独的属性列来看每列不同值的流失率,并输出每列最大流失率对应的值,以及流失率。
3.分析思路
考虑到流失用户之间可能具有的相似情况,可以对已流失用户的特征情况进行分析,然后利用这些特征来预测未流失用户的可能性。
二、流失用户预测模型
1.引入库
import pandas as pd
import torch
import torch.nn as nn
import torch.optim as optim
from sklearn.model_selection import train_test_split
from sklearn.preprocessing import StandardScaler
2.读入数据并选择模型中需要使用的相关数据列
# Read the data
data = pd.read_excel('电信客户流失分析.xlsx')

# Select relevant columns for the model
features = ['gender', 'SeniorCitizen', 'Partner', 'Dependents', 'tenure',
            'PhoneService', 'InternetService', 'Contract', 'PaperlessBilling',
            'PaymentMethod', 'MonthlyCharges']

target = 'Churn'
从Excel文件中读取数据。
定义了用于训练模型的特征列和目标列。
3.数据预处理以及数据集划分
# Preprocess the data
scaler = StandardScaler()

# Scale numerical features
data[features] = scaler.fit_transform(data[features])

# Split the data into training and test sets
train_data, test_data = train_test_split(data, test_size=0.2, random_state=42)
使用StandardScaler对数值型特征进行标准化处理。
使用train_test_split函数将数据集划分为训练集和测试集。
4.将数据转换为PyTorch张量并将张量移动到GPU
# Convert the data to PyTorch tensors
X_train = torch.Tensor(train_data[features].values)
y_train = torch.Tensor(train_data[target].values)
X_test = torch.Tensor(test_data[features].values)
y_test = torch.Tensor(test_data[target].values)

# Move the tensors to the GPU
device = torch.device('cuda' if torch.cuda.is_available() else 'cpu')
X_train = X_train.to(device)
y_train = y_train.to(device)
X_test = X_test.to(device)
y_test = y_test.to(device)
将训练集和测试集的特征和目标转换为PyTorch张量。
将张量移动到GPU设备上进行加速计算。
5.定义神经网络模型
# Define the neural network model
class ChurnPredictionModel(nn.Module):
    def __init__(self, input_dim):
        super(ChurnPredictionModel, self).__init__()
        self.fc1 = nn.Linear(input_dim, 64)
        self.fc2 = nn.Linear(64, 64)
        self.fc3 = nn.Linear(64, 1)
        self.sigmoid = nn.Sigmoid()

    def forward(self, x):
        x = self.fc1(x)
        x = self.fc2(x)
        x = self.fc3(x)
        x = self.sigmoid(x)
        return x
建立一个具有三个全连接层的神经网络模型。
6.初始化模型
# Initialize the model
input_dim = len(features)
model = ChurnPredictionModel(input_dim)
model.to(device)
初始化模型,并将模型移动到GPU设备上。
7.定义损失函数和优化器
# Define the loss function and optimizer
criterion = nn.BCELoss()
optimizer = optim.Adam(model.parameters(), lr=0.001)
使用二分类交叉熵损失函数和Adam优化器。
8.模型训练
# Train the model
num_epochs = 100
batch_size = 32

for epoch in range(num_epochs):
    for i in range(0, len(X_train), batch_size):
        inputs = X_train[i:i+batch_size]
        targets = y_train[i:i+batch_size]

        # Forward pass
        outputs = model(inputs)
        loss = criterion(outputs, targets.view(-1, 1))

        # Backward pass and optimization
        optimizer.zero_grad()
        loss.backward()
        optimizer.step()

    # Print the loss after every 10 epochs
    if (epoch + 1) % 10 == 0:
        print(f'Epoch [{epoch+1}/{num_epochs}], Loss: {loss.item():.4f}')
进行模型训练的循环,使用小批量梯度下降法进行优化。
9.评估及预测
# Evaluate the model
with torch.no_grad():
    model.eval()
    predicted_probabilities = model(X_test)
    predicted_labels = (predicted_probabilities >= 0.5).float()
    accuracy = (predicted_labels == y_test.view(-1, 1)).sum().item() / len(y_test)
    print(f'Accuracy: {accuracy:.4f}')

    # Predict churn probability for the customers who have not yet churned
    not_churned_customers = data[data['Churn'] == 0][features]
    X_not_churned = torch.Tensor(not_churned_customers.values).to(device)
    predicted_probabilities_not_churned = model(X_not_churned)
    churn_probabilities_not_churned = predicted_probabilities_not_churned.cpu().numpy().flatten()

    # Find the top 10 customers with the highest predicted churn probabilities
    top_10_customers_indices = churn_probabilities_not_churned.argsort()[-10:][::-1]
    top_10_customers = not_churned_customers.iloc[top_10_customers_indices]
    # Inverse transform the scaled values to get original values
    top_10_customers_original = scaler.inverse_transform(top_10_customers)
    top_10_churn_probabilities = churn_probabilities_not_churned[top_10_customers_indices]


    print('\nTop 10 customers with the highest predicted churn probabilities:')
    customer_attributes_count = Counter()
    for i in range(len(top_10_customers)):
        customer_index = top_10_customers_indices[i]
        customer = not_churned_customers.iloc[customer_index]
        churn_probability = top_10_churn_probabilities[i]

        original_customer = scaler.inverse_transform([customer])[0]

        print(f'Customer:')
        for feature, value in zip(features, original_customer):
            print(f'{feature}: {value}')
            # Increment the count for each attribute value
            customer_attributes_count[(feature, value)] += 1

        print(f'Churn Probability: {churn_probability:.4f}')
        print('-------------------------')

    print('\nCount and percentage of attribute values for the top 10 customers:')
    for attribute, count in customer_attributes_count.items():
        percentage = count / 10 * 100
        print(f'{attribute[0]}: {attribute[1]} - Count: {count}, Percentage: {percentage:.2f}%')
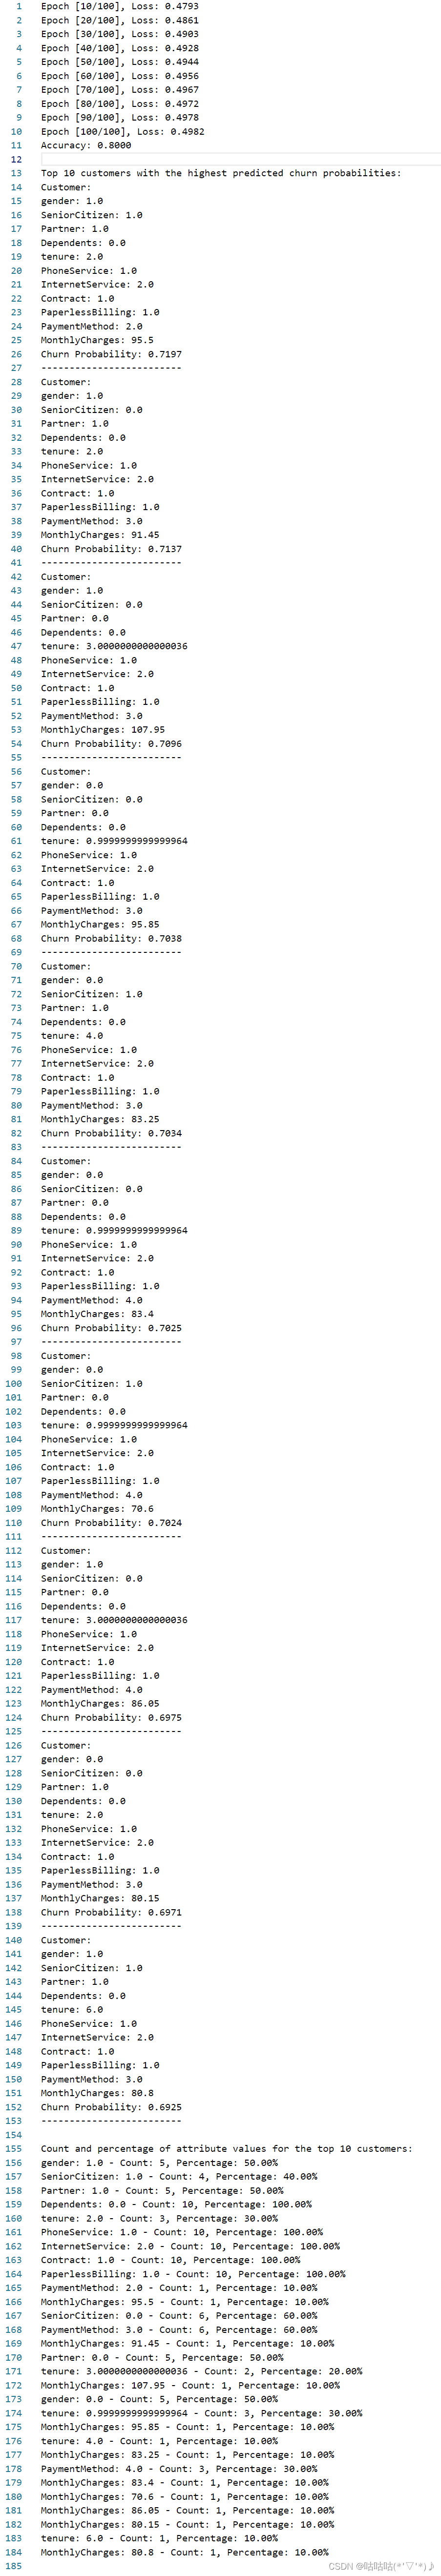
在测试集上评估模型的准确率。
选择未流失客户的特征,并使用模型预测其流失概率。
根据预测的流失概率排序,找到前10位客户。
输出前10位客户的信息和预测的流失概率。
在统计计数后,计算每个属性对应值在前10位客户中的出现比例。
三、结果分析
结合此先数据流失率情况的分析(如下)以及之后每个属性对应值在前10位客户中的出现比例。
可以从以上分析结果中看出,Dependents、PhoneService、InternetService、Contract、PaperlessBilling、PaymentMethod对于用户是否流失的影响较大。该公司需要关注属性值有Dependents=0,PhoneService=1,InternetService=2,Contract=1,PaperlessBilling=1,PaymentMethod=3的人群。
总的建议如下三点:
1、Dependents(家庭成员)属性对客户流失情况有较大影响。该公司应该重点关注没有家庭成员(Dependents=0)的客户群体。针对这部分客户,可以考虑提供更多的个性化服务,例如家庭套餐优惠、亲属推荐奖励等,以增强客户的黏性和忠诚度。
2、PhoneService(电话服务)属性也对客户流失有一定的影响。特别是使用电话服务(PhoneService=1)的客户,可能更容易流失。该公司可以关注这部分客户的需求和反馈,提供更好的通信服务,增加客户满意度,从而减少流失率。
3、InternetService(互联网服务)、Contract(合约类型)、PaperlessBilling(电子账单)、PaymentMethod(支付方式)等属性也对客户流失有较大影响。针对这些属性值对流失有较高影响的客户,可以采取相应措施,例如优化网络服务质量、提供更灵活的合约选择、简化电子账单支付流程、推出更多支付方式等,以提高客户满意度和留存率。
考虑到实际生活中各个属性可能具有一定的相关性,而本代码中并没有足够地考虑到这点,所以此后可以通过一些属性之间的相关性分析,考虑到各属性的共同作用来预测结果。


 1028
1028

 被折叠的 条评论
为什么被折叠?
被折叠的 条评论
为什么被折叠?
 到【灌水乐园】发言


