


安装Echarts
目前使用的版本是5.4
npm install echarts --save使用Echarts
import { createApp } from 'vue'
import App from './App.vue'
//引入echarts
import * as echarts from 'echarts';

const app= createApp(App)
//放入全局
app.config.globalProperties.$echarts = echarts
app.mount('#app')
html准备一个容器
<template>
  <div id='showorders' style='width:300px; height:300px;position: absolute;'></div>
</template>
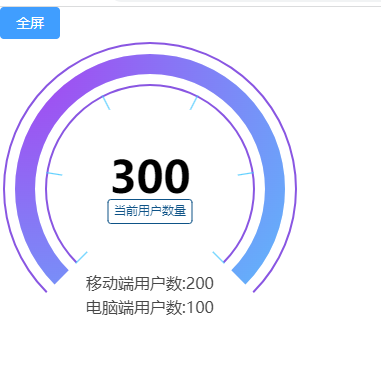
js代码(重点用***标明,可以直接使用,效果图在下面)
<script setup lang='ts'>
import { onMounted, reactive} from 'vue';

//***引入
import * as echarts from 'echarts';

let data = reactive({
  mobile:200,//移动端
  computer:100,//电脑端
})

const showorders =()=>{
  //  基于准备好的dom,初始化echarts实例
  let myChart = echarts.init(document.getElementById('showorders')!);
  // 指定图表的配置项和数据
  let option = {
  series: [
    {//外圈
      type: 'gauge',
      min: 0,
      max: 1,
      center: ['50%','50%'],
      radius: '98%',
      animation :false,
      axisLine: {//外圈大小
        lineStyle: {
          color:[[1, '#8956e2']],
          width: 2,
        }
      },
      progress:{show:false},
      pointer: {show:false},
      axisTick: {show:false},
      splitLine: {show:false},
      axisLabel: {show:false}
    },
    {//内圈
      type: 'gauge',
      min: 0,
      max: 1,
      center: ['50%','50%'],
      radius: '70%',
      animation :false,
      axisLine: {
        lineStyle: {
          color:[[1, '#8956e2']],
          width: 2,
        }
      },
      progress:{show:false},
      pointer: {show:false},
      axisTick: {show:false},
      splitLine: {show:false},
      axisLabel: {show:false}
    },
    {//主要内容
      type: 'gauge',//测量仪器
      animation :false,//是否开启动画
      startAngle: 225,//仪表盘起始角度(左180,右0)
      endAngle: -45,//仪表盘结束角度。
      center: ['50%', '50%'],//的中心(圆心)坐标
      radius: '90%',//仪表盘半径,(百分比是相对容器)
      min: 0,//最小的数据值
      max: 1,//最大的数据值
      splitNumber: 1,//仪表盘刻度的分割段数
      axisLine: {//仪表盘轴线样式
        lineStyle: {
          width: 20,//轴线与刻度的距离
        }
      },
      color:{//向渐变,前三个参数分别是圆心 x, y 和半径,取值同线性渐变
        type: 'radial',
        x: 0,
        y: 0,
        r: 2,
        colorStops: [{
            offset: 0, color: '#9a3bdb' // 0% 处的颜色
        }, {
            offset: 1, color: '#43c7ff' // 100% 处的颜色
        }],
        global: false // 缺省为 false
      },
      progress:{//展示当前进度(代替仪表盘轴线样式,它没有渐变)
        show:true,
        overlap: false,
        width:20,
      },
      pointer: {//仪表盘指针不显示
        show:false,
      },
      axisTick: {//刻度样式 (小的)
        length: 16,
        lineStyle: {
          color: '#43c7ff',
          width: 1
        }
      },
      splitLine: {//分隔线样式 (大的)
        show:false
      },
      axisLabel: {//刻度标签
        show:false,
      },
      detail: {//仪表盘详情,用于显示数据(value的样式)
        fontSize: 44,
        lineHeight:50,
        height:200,
        offsetCenter: [0, '50%'],//位置偏移
        valueAnimation: true,
        color: 'inherit',
        formatter: function (value: number) {
          const str =  '{user|\n当前用户数量}';
          return `${Math.round(value * 1)}${str}`;
        },
        rich: {//富文本样式
            user: {//与formatter 中的 | 左侧 文本一样名
                color: '#0e5387',
                lineHeight: 10,
                borderColor:"#0e5387",
                borderWidth:1,
                borderType:'solid',
                borderRadius:3,
                padding:6,
            },
        }
      },
      title:{//name的样式
        offsetCenter :[0, '80%'],
        color:'#464646',
        fontSize:16,
        lineHeight:24
      },
      data: [//表盘的数据
        {
          value: data.mobile + data.computer,
          name: ` 移动端用户数:${data.mobile} \n电脑端用户数:${data.computer}`,
        }
      ]
    }
  ]
};
  option && myChart.setOption(option);
}

//*** 挂载Echarts
onMounted(()=>{
  showorders()
})


</script>
(全屏是另一个功能)
vue3做一个全屏功能 全屏功能


 4931
4931


 被折叠的 条评论
为什么被折叠?
被折叠的 条评论
为什么被折叠?
 到【灌水乐园】发言


