


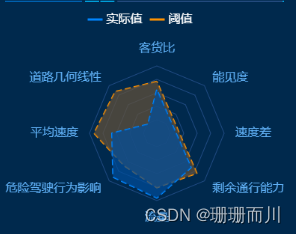
预期效果:
<template>
  <div id="operationalRisk-radar-chart" class="h-290 w-385"></div>
</template>

<script>
  export default {
    name: 'radarChart'
  }
</script>
<script setup>
  import { onMounted, reactive } from 'vue'
  import * as echarts from 'echarts'

  const options = reactive({
    color: ['#ff9200', '#0086ff'],
    legend: {
      show: true,
      //   type: 'scroll',
      //   left: 200,
      itemHeight: 3,
      itemWidth: 20,
      data: ['实际值', '阈值'],
      textStyle: {
        fontSize: 16,
        color: '#fff'
      }
    },
    radar: {
      center: [215, 165],
      radius: 90,
      indicator: [
        { name: '客货比', max: 6500 },
        { name: '道路几何线性', max: 16000 },
        { name: '平均速度', max: 30000 },
        { name: '危险驾驶行为影响', max: 38000 },
        { name: '流量', max: 52000 },
        { name: '剩余通行能力', max: 25000 },
        { name: '速度差', max: 25000 },
        { name: '能见度', max: 25000 }
      ],
      //   刻度线颜色
      splitLine: {
        lineStyle: {
          color: '#214b83'
        }
      },
      //   轴线不显示
      axisLine: {
        show: false
        // lineStyle: {
        //   color: 'pink'
        // }
      },
      //   文字颜色
      axisName: {
        color: '#5faff4',
        fontSize: 16
      },
      splitArea: {
        // (圆中间的圆环分隔的区域)坐标轴在 grid 区域中的分隔区域,默认不显示。
        areaStyle: {
          // 分隔区域的样式设置。
          show: false,
          color: 'rgba(1, 1, 1, 0)',
          shadowColor: 'rgba(0, 0, 0, 0.2)',
          shadowBlur: 10
        }
      },
      axisradar: {
        // (圆内的几条直线)坐标轴轴线相关设
        show: false
      }
    },
    series: [
      {
        name: 'Budget vs spending',
        type: 'radar',
        itemStyle: {
          lineStyle: {
            type: 'dashed'
          }
        },
        data: [
          {
            value: [5000, 14000, 28000, 26000, 42000, 21000],
            name: '阈值',
            areaStyle: {
              color: '#655137'
            },
            symbol: 'none', // 数据点不要圆点样式
            lineStyle: {
              type: 'dashed' // 线条样式为虚线
            }
          },
          {
            value: [4200, 3000, 20000, 35000, 50000, 18000],
            name: '实际值',
            symbol: 'none',
            areaStyle: {
              color: '#004d9c'
            },
            lineStyle: {
              type: 'dashed'
            }
          }
        ]
      }
    ]
  })
  // 创建基础折线图
  const createradarChart = () => {
    const chart = echarts.init(document.getElementById('operationalRisk-radar-chart'))
    chart.setOption(options)
  }

  // 在组件加载时创建折线图
  onMounted(() => {
    setTimeout(() => {
      createradarChart()
    }, 1000)
  })
</script>
<style lang="scss" scoped></style>


 2万+
2万+


 被折叠的 条评论
为什么被折叠?
被折叠的 条评论
为什么被折叠?
 到【灌水乐园】发言


