爬取数据保存为json
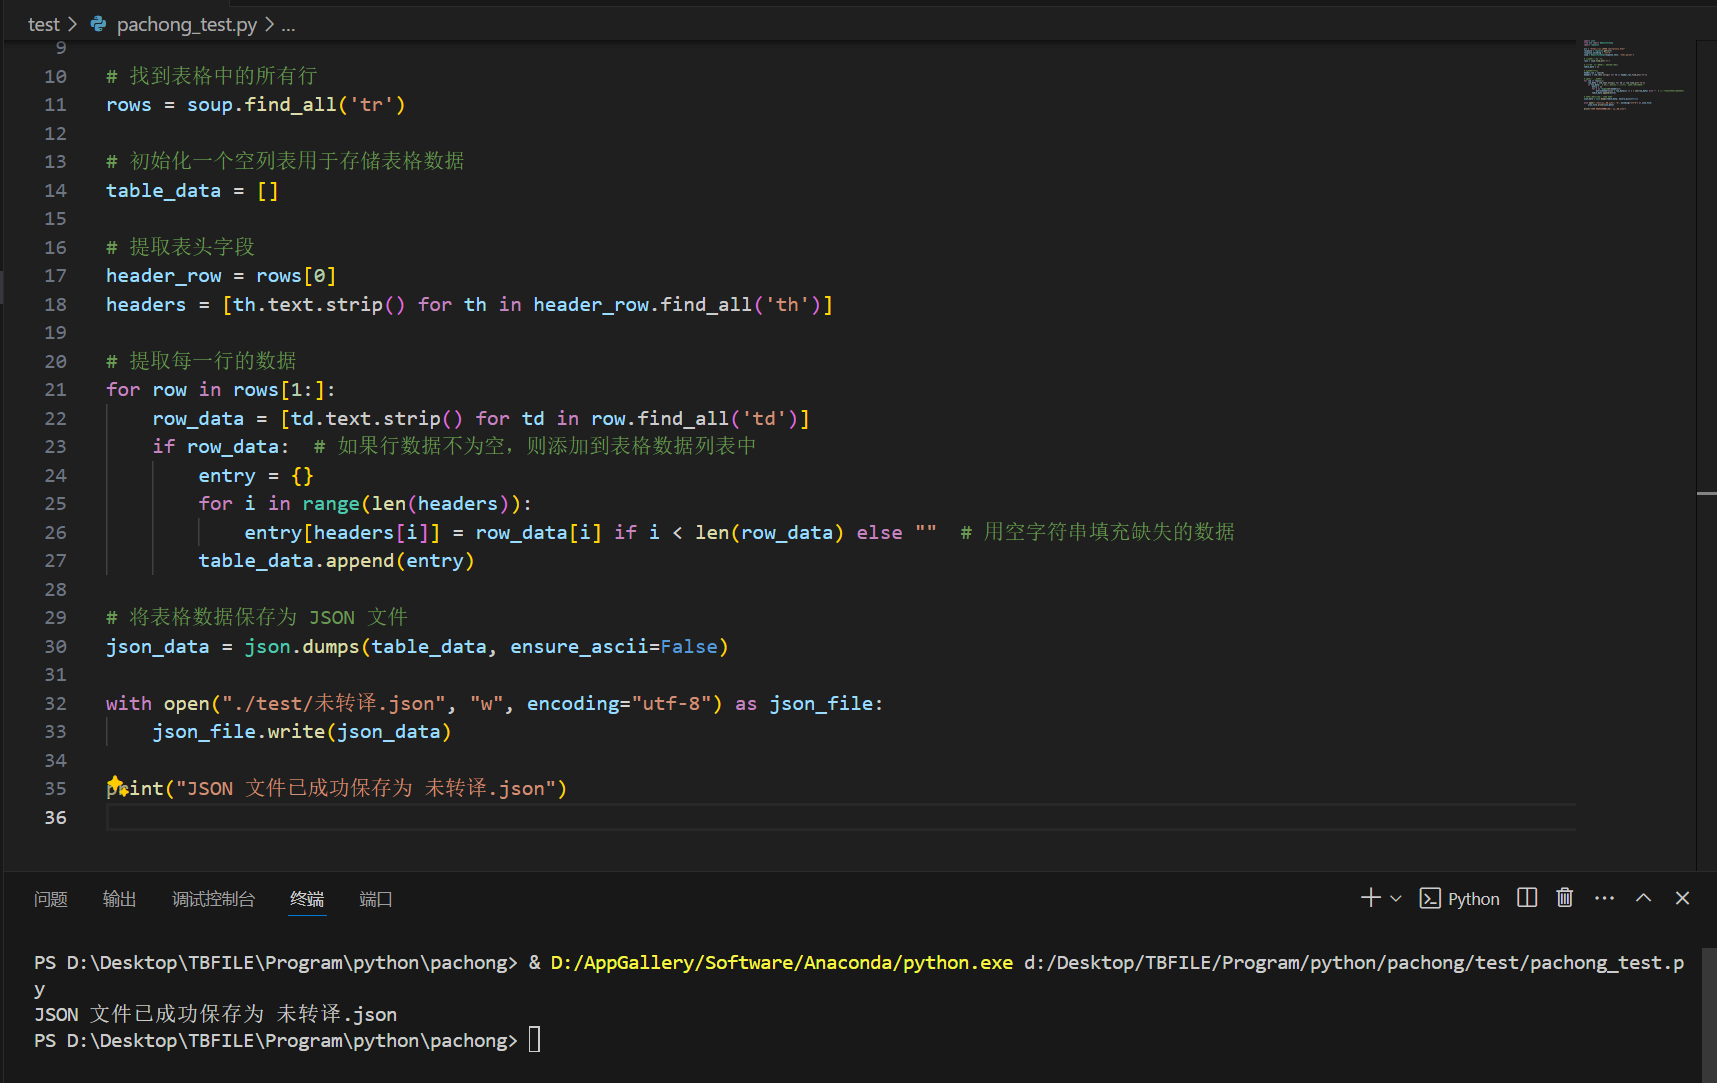
pachong.py
import json
from bs4 import BeautifulSoup
import requests
url = "https://xl.16888.com/factory.html"
response = requests.get(url)
response.encoding = 'utf-8'
soup = BeautifulSoup(response.text, 'html.parser')
rows = soup.find_all('tr')
table_data = []
header_row = rows[0]
headers = [th.text.strip() for th in header_row.find_all('th')]
for row in rows[1:]:
row_data = [td.text.strip() for td in row.find_all('td')]
if row_data:
entry = {}
for i in range(len(headers)):
entry[headers[i]] = row_data[i] if i < len(row_data) else ""
table_data.append(entry)
json_data = json.dumps(table_data, ensure_ascii=False)
with open("./test/未转译.json", "w", encoding="utf-8") as json_file:
json_file.write(json_data)
print("JSON 文件已成功保存为 未转译.json")
运行截图
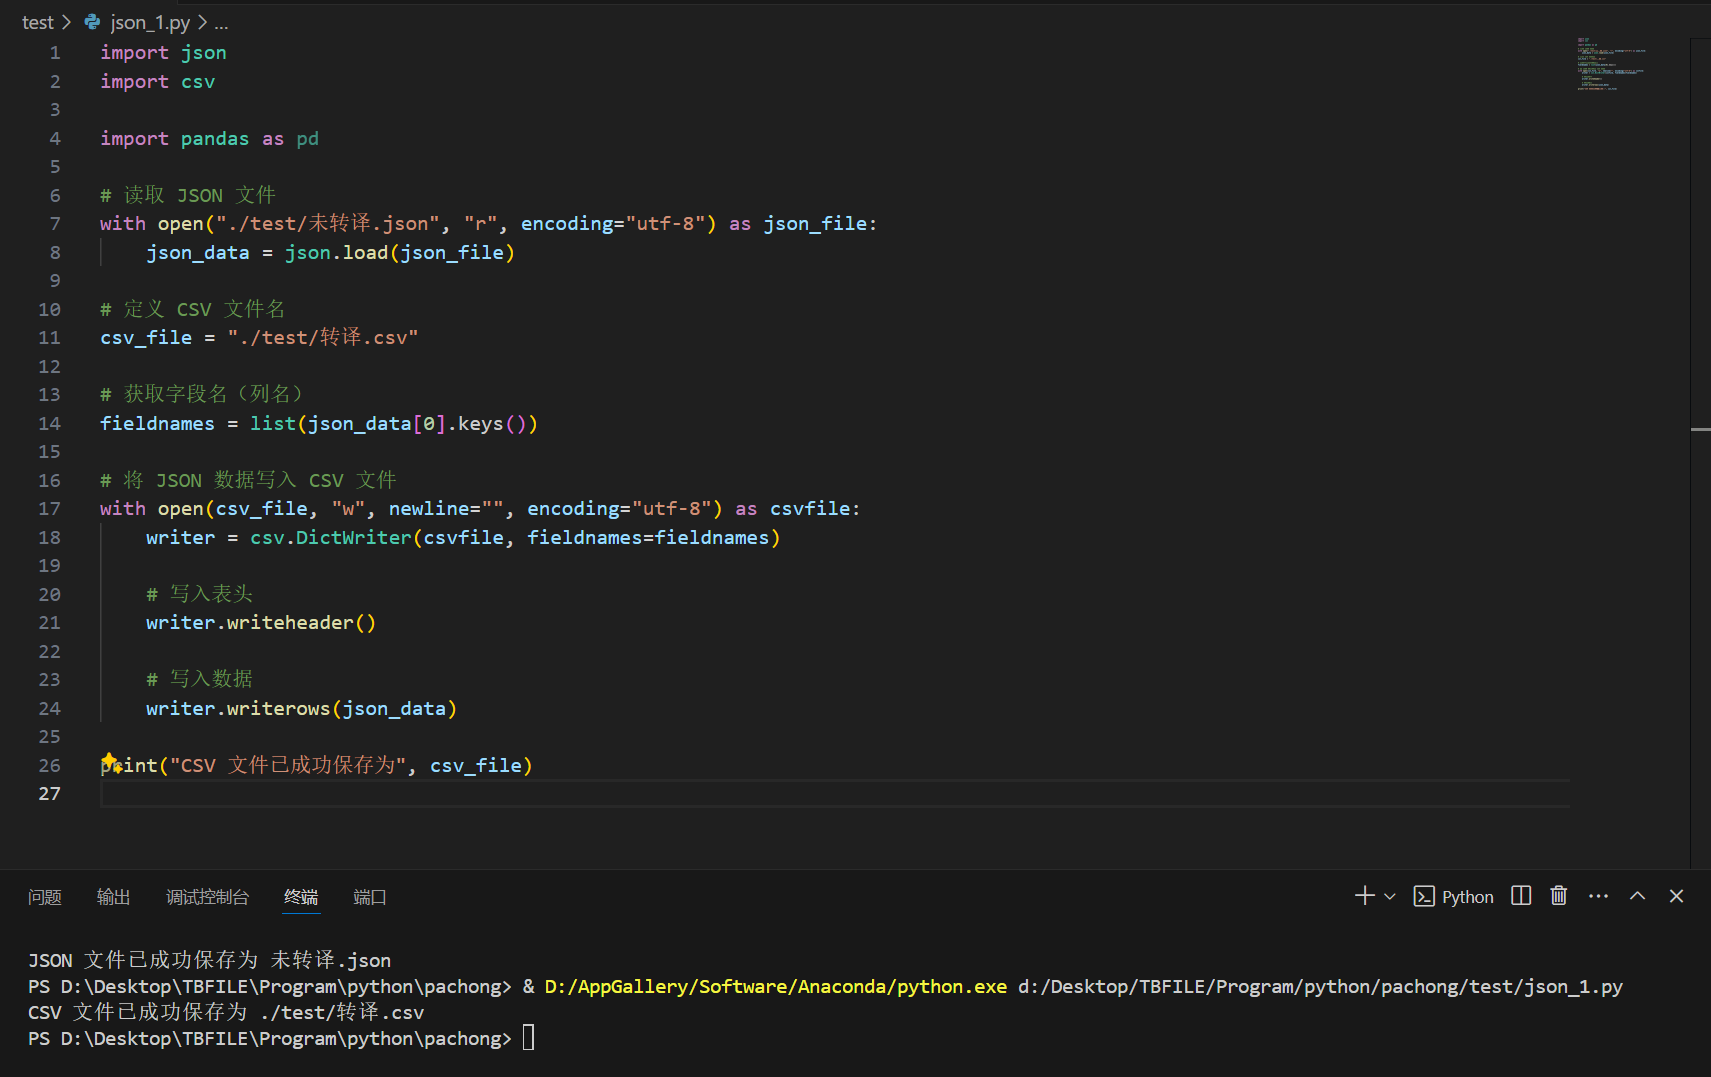
json文件处理
json_1.py
import json
import csv
import pandas as pd
with open("./test/未转译.json", "r", encoding="utf-8") as json_file:
json_data = json.load(json_file)
csv_file = "./test/转译.csv"
fieldnames = list(json_data[0].keys())
with open(csv_file, "w", newline="", encoding="utf-8") as csvfile:
writer = csv.DictWriter(csvfile, fieldnames=fieldnames)
writer.writeheader()
writer.writerows(json_data)
print("CSV 文件已成功保存为", csv_file)
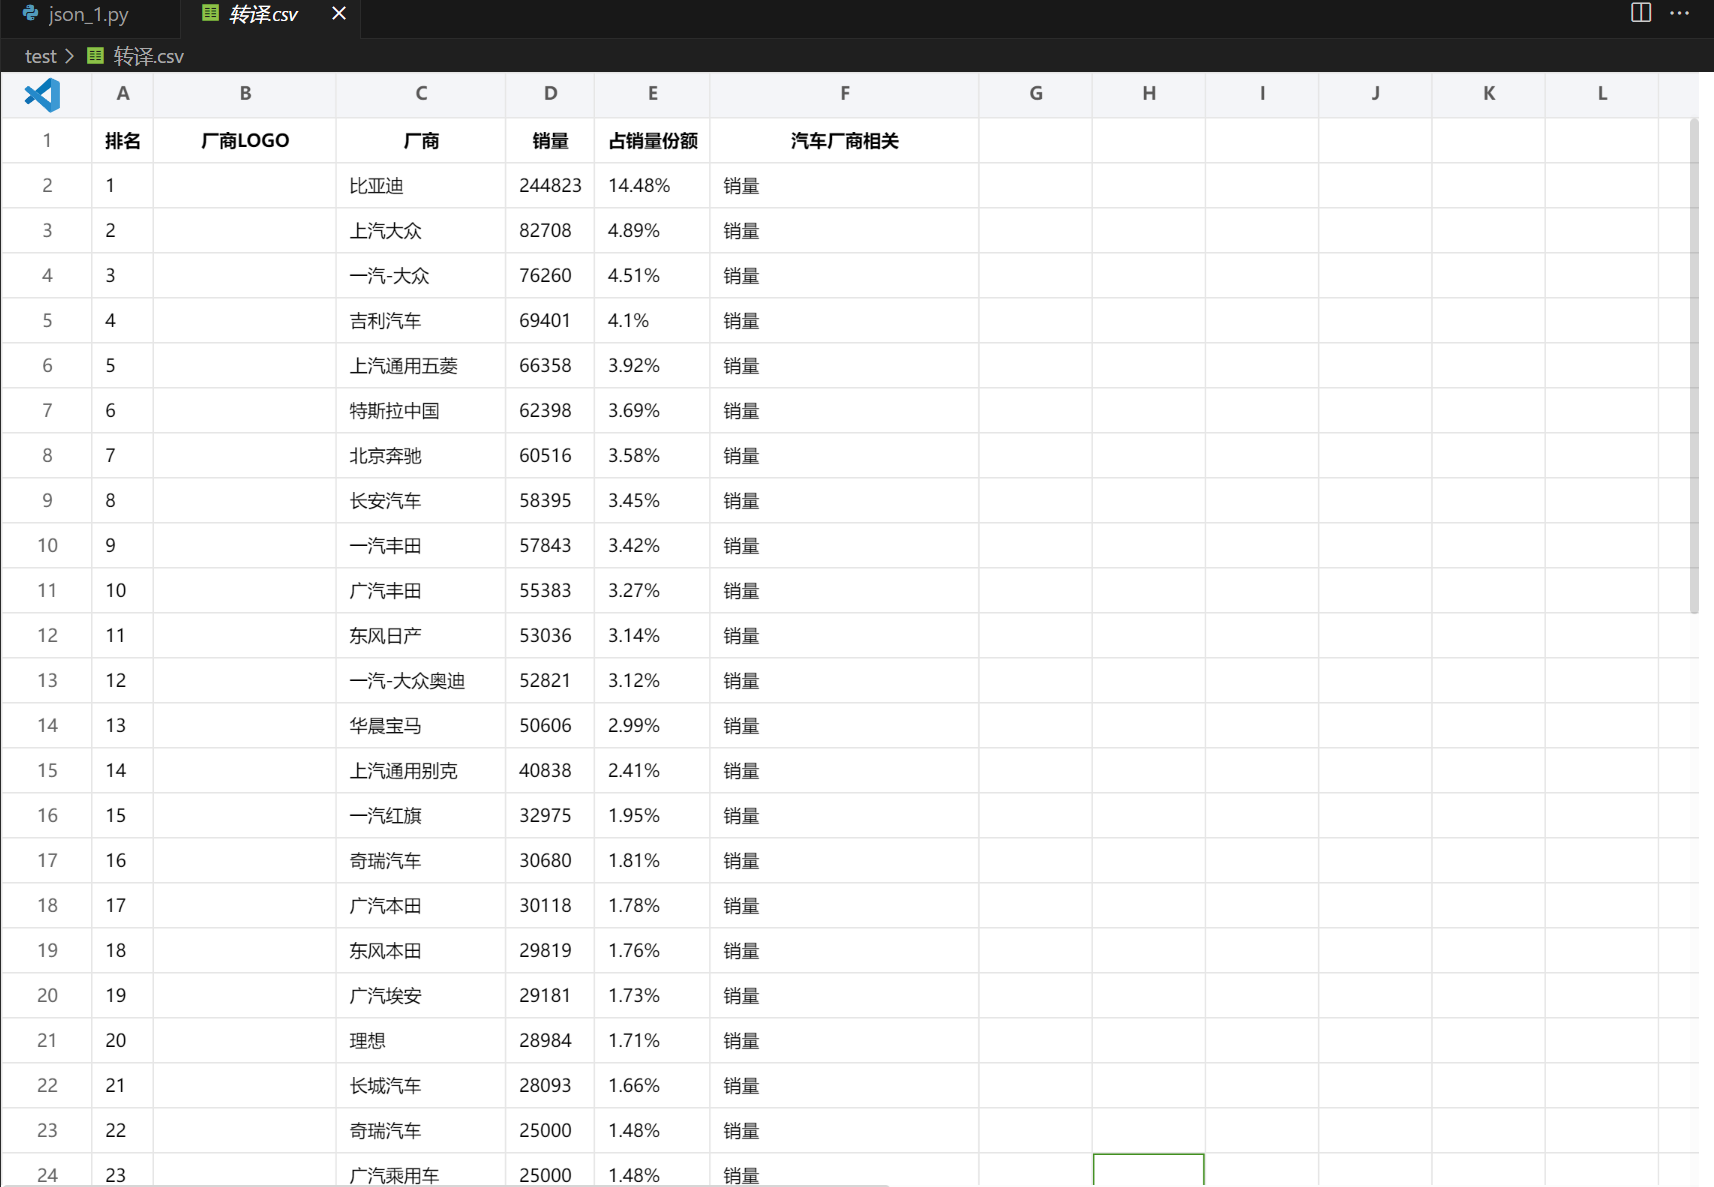
运行截图
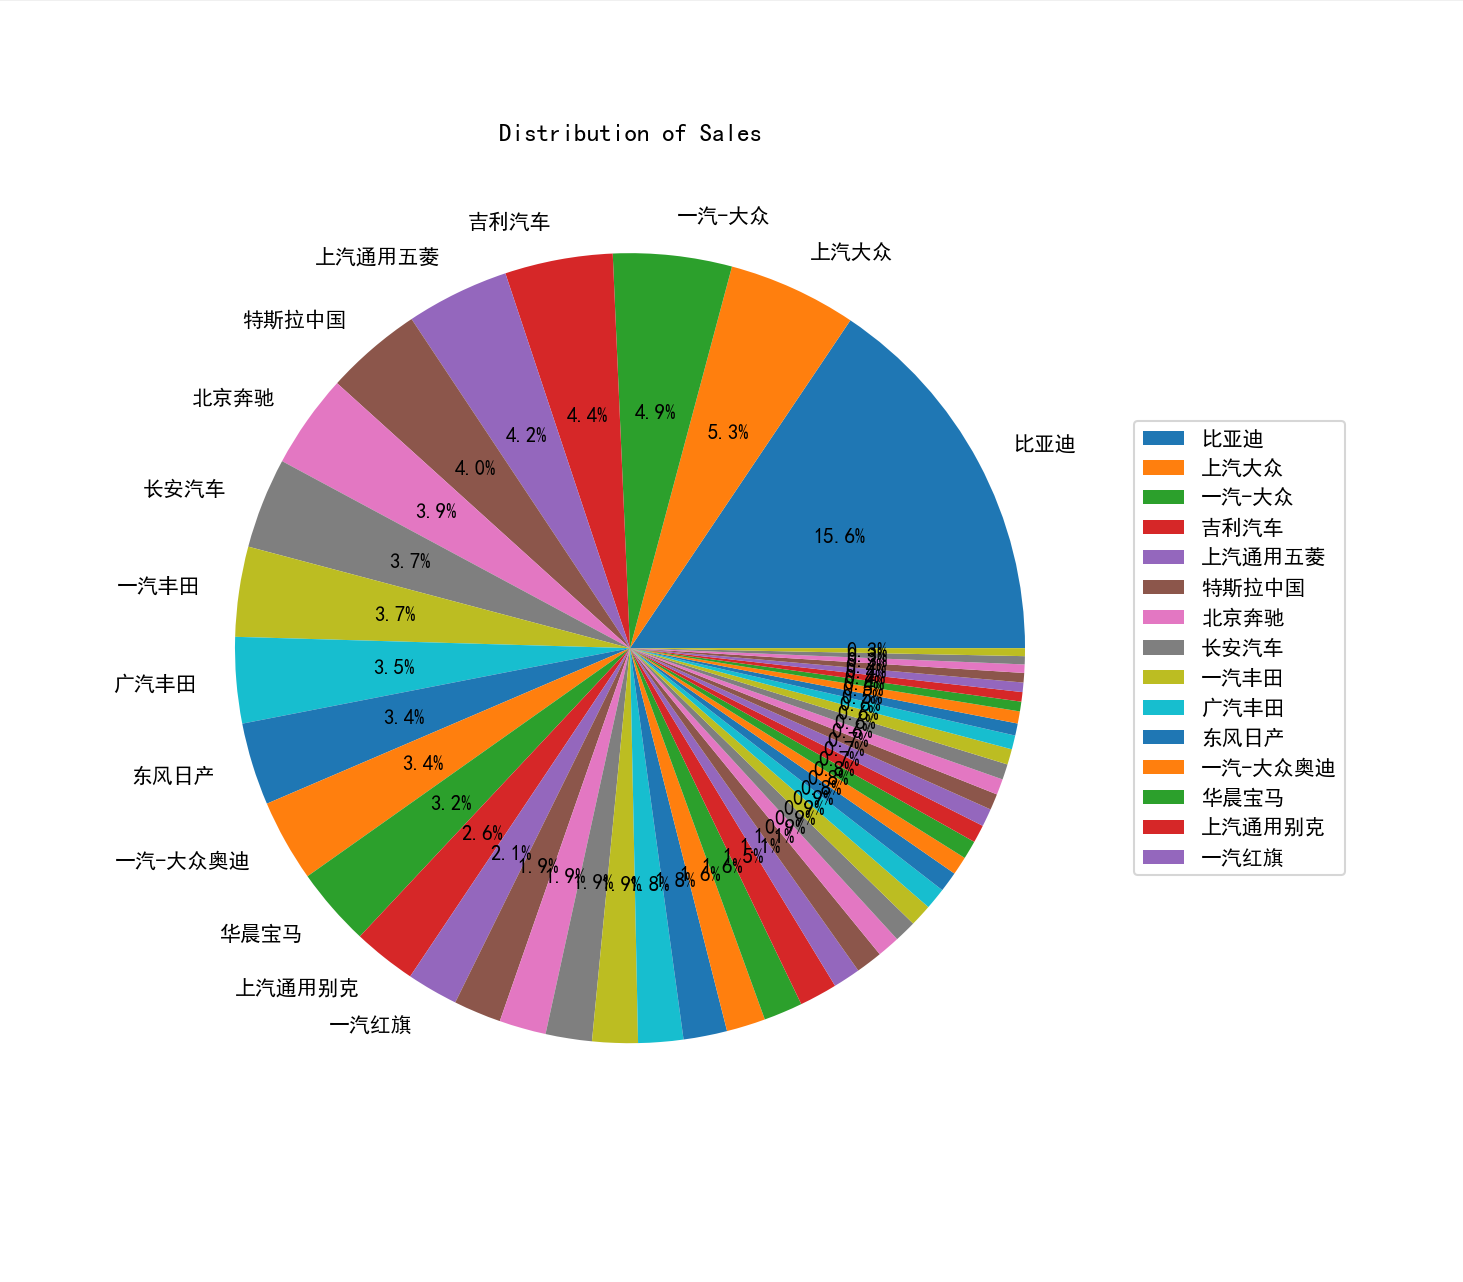
数据处理,可视化
import pandas as pd
import matplotlib.pyplot as plt
plt.rcParams['font.sans-serif'] = ['SimHei']
data = pd.read_csv("./test/转译.csv")
data_cleaned = data.drop(data.columns[[0, 1]], axis=1)
data_cleaned = data_cleaned.drop(data_cleaned.index[-1])
data_cleaned['占销量份额'] = data_cleaned['占销量份额'].str.rstrip('%').astype('float')
sales_data = data_cleaned['占销量份额']
total_sales = sales_data.sum()
percentages = sales_data / total_sales * 100
labels = data_cleaned['厂商']
labels[percentages < 2] = None
plt.figure(figsize=(8, 8))
plt.pie(sales_data, labels=labels, autopct='%1.1f%%')
plt.title('Distribution of Sales')
plt.legend(labels[labels.notnull()], loc='center left', bbox_to_anchor=(1, 0.5))
plt.savefig('./test/销量分布.png')
plt.show()
运行截图


 被折叠的 条评论
为什么被折叠?
被折叠的 条评论
为什么被折叠?
 到【灌水乐园】发言


