


数据集介绍
这个土壤湿度数据集由时空三级大数据平台提供,是中国范围内1km高质量的土壤湿度数据集-SMCI1.0(Soil Moisture of China by in situ data, version 1.0),SMCI1.0是包含2000-2020年、日尺度、以10厘米为间隔10层深度(10-100cm)的高时空分辨率土壤湿度。该数据集是以中国气象局提供的1,648个站点观测10层土壤湿度作为基准,使用ERA5_Land时间序列数据、叶面积指数(LAI)、土地覆盖类型(Landtypes)、地形(DEM)和土壤特性(Soil properties)作为协变量,通过机器学习方式获得。我们进行了两组实验以验证SMCI1.0的精度,时间尺度上:ubRMSE为0.041-0.052,R为0.883-0.919;空间尺度上:ubRMSE为0.045-0.051,R为0.866-0.893。 由于SMCI1.0是基于实地观测的土壤湿度,它可以作为现有基于模型和卫星数据集的有效补充。该数据产品可用于各种水文、气象、生态分析和建模,尤其在需要高质量、高分辨率土壤湿度的应用上至关重要。为便于使用,提供了两种不同分辨率的版本:30 秒约1km和0.1度约9km。
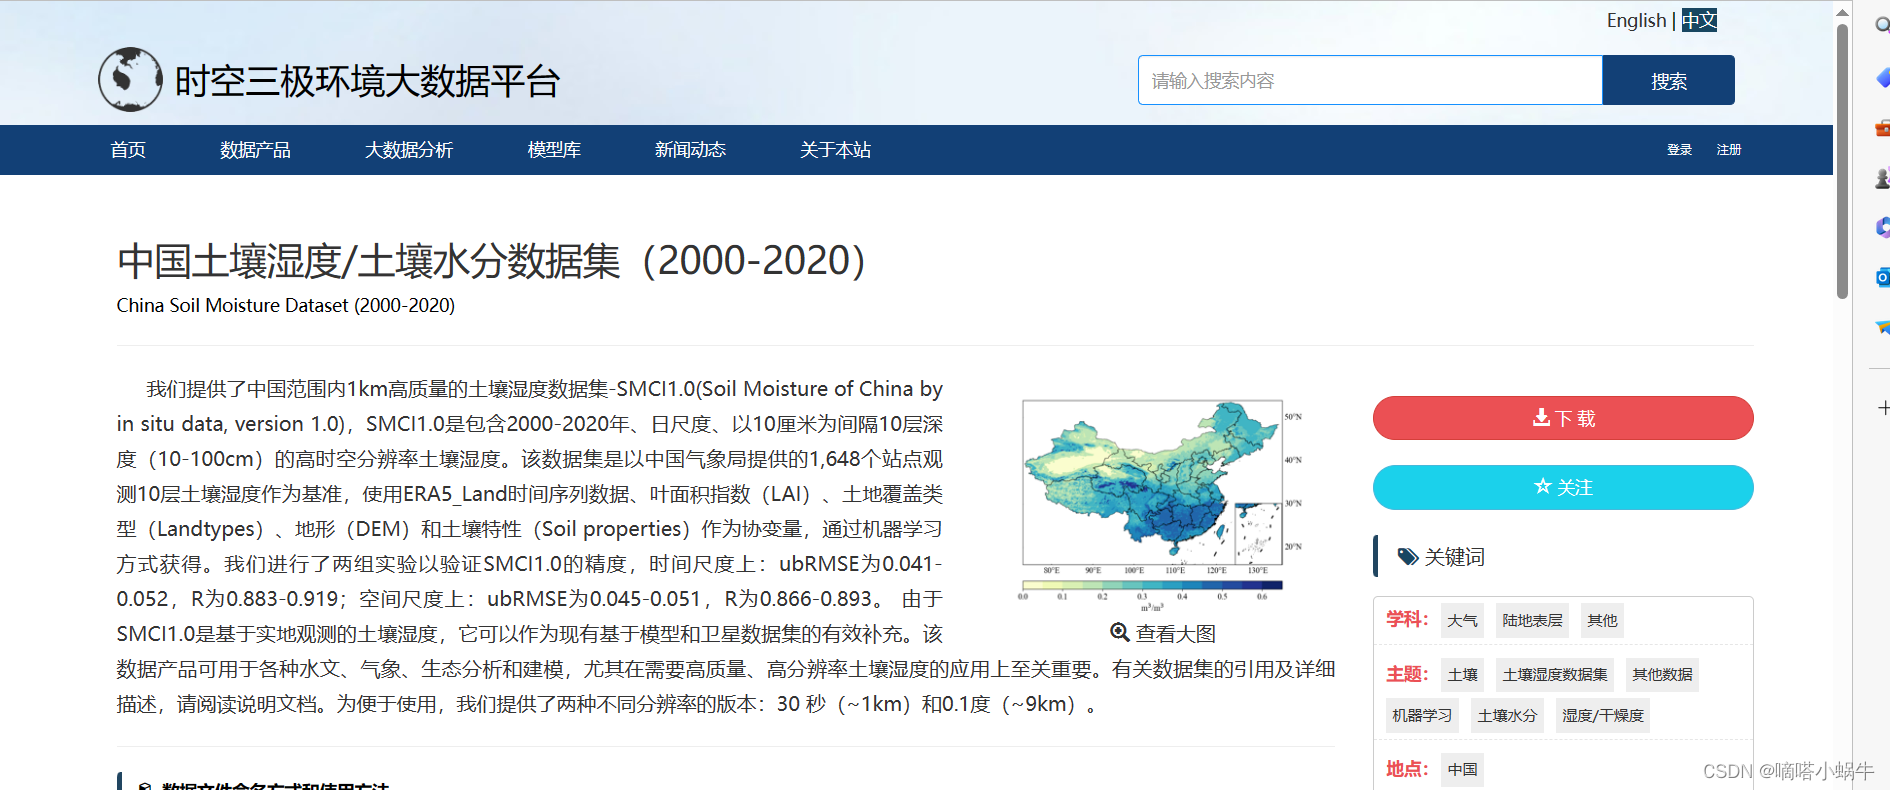 时空三极大数据链接: https://poles.tpdc.ac.cn/zh-hans/data/49b22de9-5d85-44f2-a7d5-a1ccd17086d2/?q=
获取一年数据每月均值的代码展示
本代码目的是获取所选点位(经纬度)周边一定范围内的土壤湿度每日均值,并将一年内每天的土壤湿度进行折线图展示,并将每日土壤湿度数据以excel表格形式导出。
%本代码由中国地质大学(北京)测绘工程专业cqp编写
%2024年3月
clc
clear
% 读取文件路径
ncfile = 'E:\SMCI_1km_2020_10cm\SMCI_1km_2020_10cm.nc';
ncdisp(ncfile);
%读取土壤湿度文件的经纬度数据
lat = ncread(ncfile,'lat');
lon = ncread(ncfile,'lon');
% 定义一个所需点经纬度(十进制)(lat_point、lon_point)
lat_point = 41; %纬度
lon_point =116; %经度
% 定义目标网格的范围
lat_range = [lat_point - 0.018, lat_point + 0.018]; % 更新为您想要的范围
lon_range = [lon_point - 0.0185, lon_point + 0.0185]; % 更新为您想要的范围
%定义日期矩阵存储数据
Data = zeros(1, 365);
for time_real = 0:364
% 获取数据在文件中的索引范围
lon_start = find(ncread(ncfile, 'lon') >= lon_range(1), 1);
lon_end = find(ncread(ncfile, 'lon') <= lon_range(2), 1, 'last');
lat_start = find(ncread(ncfile, 'lat') >= lat_range(1), 1);
lat_end = find(ncread(ncfile, 'lat') <= lat_range(2), 1, 'last');
% 读取时间信息
time = ncread(ncfile, 'time');
time_units = ncreadatt(ncfile, 'time', 'units');
time_calendar = ncreadatt(ncfile, 'time', 'calendar');
% 寻找时间对应的索引
time_index = find(time == time_real);
% 读取数据
SMCI_real = ncread(ncfile, 'SMCI', [lon_start, lat_start, time_index], [lon_end - lon_start + 1, lat_end - lat_start + 1, 1]);
% 显示结果
disp('Data loaded successfully.');
% 找到SMCI_real中值为-999的位置,此值为缺失值。
missing_values = (SMCI_real == -999);
% 将缺失值设为NaN
SMCI_real(missing_values) = NaN;
% 计算 SMCI_real 的均值(忽略NaN)
average_SMCI = nanmean(SMCI_real, 'all') * 0.001;
Data(time_real + 1) = average_SMCI;
% 显示均值
disp(['所选范围的土壤湿度均值 ' num2str(average_SMCI)]);
end
% 最后 Date 数组中存储了每天的均值
disp('计算完成');
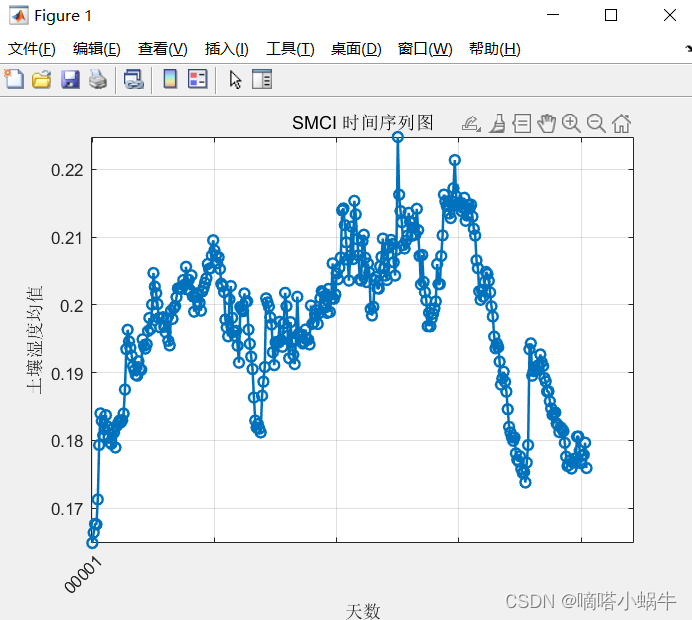
% 绘制时间序列图
figure;
plot(Data, '-o', 'LineWidth', 1.5, 'MarkerSize', 6);
% 设置图形标题和坐标轴标签
title('SMCI 时间序列图');
xlabel('天数');
ylabel('土壤湿度均值');
% 添加网格线
grid on;
% 设置坐标轴刻度
xticks(1:90:365); % 每隔30天显示一个刻度
% 显示日期
date_labels = datestr(datenum('2019-01-01') + (0:364), 'mm/dd');
xticklabels(date_labels(1:90:365));
% 旋转日期标签,以免重叠
xtickangle(45);
% 设置 Y 轴范围
ylim([min(Data), max(Data)]);
writematrix(Data', '土壤湿度数据.xlsx');
disp('土壤湿度数据导出完毕.xlsx');
运行结果
获取两年乃至多年每月均值的代码
本代码目的是获取选定区域两年内每个月的土壤湿度均值,并绘制时间变化折线图。
%本代码由中国地质大学(北京)测绘工程专业cqp编写
%2024年3月
clc
clear
% 读取文件路径
ncfile1 = 'E:\SMCI_1km_2019_10cm\SMCI_1km_2019_10cm.nc';
ncfile2 = 'E:\SMCI_1km_2020_10cm\SMCI_1km_2020_10cm.nc';
ncdisp(ncfile1);
% 读取土壤湿度文件的经纬度数据
lat = ncread(ncfile1, 'lat');
lon = ncread(ncfile1, 'lon');
% 定义矢量边界四个点的经纬度
boundary_points = [
    103.402038574520645, 37.276000976264072;
    98.652282714875469, 36.667724609303320;
    97.498779296627276, 41.207824706644942;
    102.457824707444331, 41.765747069971383;
];
% 确定矩形区域内的经纬度点的行列索引
min_lon = min(boundary_points(:, 1));
max_lon = max(boundary_points(:, 1));
min_lat = min(boundary_points(:, 2));
max_lat = max(boundary_points(:, 2));
% 找出位于矩形区域内的经纬度点的行列索引
lon_indices = find(lon >= min_lon & lon <= max_lon);
lat_indices = find(lat >= min_lat & lat <= max_lat);
% 初始化每月土壤湿度均值数组
num_months = 24;  % 两年共24个月
average_SMCI_per_month = zeros(num_months, 1);
% 循环读取两年中所有月份的土壤湿度数据,并计算每月的均值
disp('正在计算,请稍等');
for year = 1:2
    for month = 1:12
        % 确定每月的起始和结束日期
        start_day = (month - 1) * 30 + 1;
        end_day = month * 30;
        if month == 12
            end_day = 365;  % 如果是12月份,最后一天为365
        end
        % 读取土壤湿度数据
        if year == 1
            ncfile = ncfile1;
        else
            ncfile = ncfile2;
        end
        SMCI_monthly = zeros(length(lon_indices), length(lat_indices), end_day - start_day + 1);
        for day = start_day:end_day
            SMCI_monthly(:, :, day - start_day + 1) = ncread(ncfile, 'SMCI', [lon_indices(1), lat_indices(1), day], [length(lon_indices), length(lat_indices), 1]);
        end
        % 找到空值(-999),并将其设为 NaN
        SMCI_monthly(SMCI_monthly == -999) = NaN;

        % 计算每月的平均值并乘以0.001
        index = (year - 1) * 12 + month;
        average_SMCI_per_month(index) = nanmean(SMCI_monthly(:)) * 0.001;
    end
end
% 绘制土壤湿度月度均值图
figure;
plot(1:num_months, average_SMCI_per_month, '-o', 'LineWidth', 1.5, 'MarkerSize', 6);
title('土壤湿度月度均值图');
xlabel('月份');
ylabel('土壤湿度均值');
xticks(1:num_months);
grid on;
% 创建 Excel 文件
filename = 'sentinel范围内土壤湿度月度数据.xlsx';
xlswrite(filename, {'月份', '土壤湿度均值'}, 'Sheet1', 'A1');
xlswrite(filename, [(1:num_months)', average_SMCI_per_month], 'Sheet1', 'A2');
disp(['土壤湿度月度数据已成功导出到 ', filename]);
运行结果

求出一片区域某月均值,并显示和导出TiFF格式
上述两个代码均为时序折线图,**那么如何获取直观的地图形式呢?**下面的代码旨在获取某月某区域的土壤湿度地图。
%本代码由中国地质大学(北京)测绘工程专业cqp编写
%2024年3月
clc
clear
% 引用坐标系
[A, R] = geotiffread('smyangben1.tif'); % 该处路径为上述Arcgis中导出带坐标系的TIFF文件**需要调整**
info = geotiffinfo('smyangben1.tif'); % 该处路径为上述Arcgis中导出带坐标系的TIFF文件 **需要调整**
% 读取文件路径
ncfile1 = 'E:\SMCI_1km_2020_10cm\SMCI_1km_2020_10cm.nc';
ncdisp(ncfile1);
% 读取土壤湿度文件的经纬度数据
lat = ncread(ncfile1, 'lat');
lon = ncread(ncfile1, 'lon');
% 定义矢量边界四个点的经纬度
boundary_points = [
    [103.4, 37.2],
    [98.6, 36.6],
    [97.5, 41.2],
    [102.4, 41.7]
];
% 确定矩形区域内的经纬度点的行列索引
min_lon = min(boundary_points(:, 1));
max_lon = max(boundary_points(:, 1));
min_lat = min(boundary_points(:, 2));
max_lat = max(boundary_points(:, 2));
% 找出位于矩形区域内的经纬度点的行列索引
lon_indices = find(lon >= min_lon & lon <= max_lon);
lat_indices = find(lat >= min_lat & lat <= max_lat);
% 循环读取2020年8月的土壤湿度数据,并计算月均值
disp('正在计算,请稍等');
year = 2020;
month =7 ;
% 确定8月的起始和结束日期
start_day = (month - 1) * 30 + 1;
end_day = month * 30;
if month == 12
    end_day = 365;  % 如果是12月份,最后一天为365
end
% 读取土壤湿度数据
SMCI_monthly = zeros(length(lon_indices), length(lat_indices), end_day - start_day + 1);
for day = start_day:end_day
    SMCI_monthly(:, :, day - start_day + 1) = ncread(ncfile1, 'SMCI', [lon_indices(1), lat_indices(1), day], [length(lon_indices), length(lat_indices), 1]);
end
% 找到空值(-999),并将其设为 NaN
SMCI_monthly(SMCI_monthly == -999) = NaN;
% 计算每月的平均值
average_SMCI_per_month = nanmean(SMCI_monthly, [1 2 3])*0.001; % 按照所有维度计算平均值
% 显示2020年8月的土壤湿度均值
disp(['2020年8月的土壤湿度均值为: ', num2str(average_SMCI_per_month), ' mm']);
% 绘制土壤湿度图像
data4 = rot90(nanmean(SMCI_monthly, 3)); % 逆时针旋转90°并计算每月平均值
data5 = flipud(data4)*0.001; % 矩阵的翻转
imagesc(data5);
title('2020年8月土壤湿度均值图');
xlabel('经度');
ylabel('纬度');
colorbar;
% 导出TIFF
filename = 'C:\Users\24555\Desktop\afterTIFF\SMCI_2020_07.tif';
geotiffwrite(filename, data5, R, 'GeoKeyDirectoryTag', info.GeoTIFFTags.GeoKeyDirectoryTag);
disp('导出成功');
运行结果

上述代码供大家借鉴,可以稍加修改获取自己想要的数据。
求赞!创作不易,如果觉得有用的话,请各位看官动动小手点个赞。


 1380
1380

 被折叠的 条评论
为什么被折叠?
被折叠的 条评论
为什么被折叠?
 到【灌水乐园】发言


