vue3+echarts 立体柱状效果

vue3+echarts 立体柱状效果

废话不多说,直接上代码 就两步,直接复制粘贴一手

 <div id="main" class="chart" ref="chartDom"></div>
import * as echarts from 'echarts';
type EChartsOption = echarts.EChartsOption;
var chartDom = document.getElementById('main');
var option: EChartsOption;

option = {
  tooltip: {
    trigger: 'axis',
    axisPointer: {
      type: 'shadow'
    }
  },
  grid: {
    top: '10%',
    left: '3%',
    right: '4%',
    bottom: '10%',
    containLabel: true
  },
  xAxis: [
    {
      type: 'category',
      data: ['天', '大', '1', '2', '3'],
      axisTick: {
        alignWithLabel: true
      },
      axisLabel: {
        color: '#ffffff',
        fontSize: 16
      }
    }
  ],
  yAxis: [
    {
      type: 'value',
      interval: 20,
      axisLabel: {
        color: '#ffffff',
        fontSize: 16
      }
    },

  ],
  series: [
    {
      name: 'Direct',
      type: 'bar',
      data: [20, 42, 36, 50, 53],
      barGap: 0,
      barWidth: 13,
      label: {
        normal: {
          show: false,
          position: "insideRight"
        }
      },
      itemStyle: {
        normal: {
          color: new echarts.graphic.LinearGradient(
            0, 0, 0, 1,
            [
              { offset: 0, color: '#8c40dc' },     //柱状图从左向右颜色渐变
              { offset: 1, color: '#1e2a4c' }
            ]
          ),
        }
      },
    },
    {
      name: 'Direct',
      type: 'bar',
      barWidth: 16,
      data: [20, 42, 36, 50, 53],
      tooltip: {
        show: false
      },
      label: {
        normal: {
          show: false,
          position: "insideRight"
        }
      },
      itemStyle: {
        normal: {
          color: "#502f92"
        }
      },
    }, {
      name: 'Direct',
      barWidth: 22,
      data: [20, 42, 36, 50, 53],
      type: "pictorialBar", // 长方体顶部四边形
      symbol: 'diamond',
      symbolRotate: 0,
      symbolSize: ['28', '10'],
      symbolOffset: ['0', '-5'],
      symbolPosition: 'end',
      z: 3, // 顶部四边形
      tooltip: {
        show: false
      },
      label: {
        normal: {
          show: false,
          position: "insideRight"
        }
      },
      itemStyle: {
        normal: {
          color: "#761c9a"
        }
      },
    },

  ]
};
onMounted(() => {
  var myChart = echarts.init(chartDom);
  option && myChart.setOption(option);
})
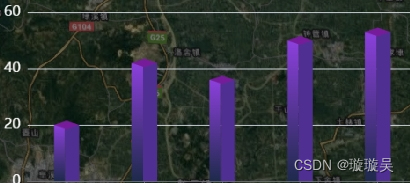
在这里插入图片描述

  • 9
    点赞
  • 9
    收藏
    觉得还不错? 一键收藏
  • 0
    评论
您好!对于Vue 3和Echarts立体环形饼图,您可以按照以下步骤进行操作: 1. 首先,您需要在Vue项目中安装Echarts。您可以使用npm或yarn命令来安装它: ```bash npm install echarts ``` 或 ```bash yarn add echarts ``` 2. 在您的Vue组件中,导入Echarts和相应的样式文件: ```javascript import * as echarts from 'echarts'; import 'echarts-gl'; import 'echarts/theme/macarons'; // 可选择其他主题 ``` 3. 在Vue组件的`mounted`生命周期钩子函数中,初始化Echarts实例并配置立体环形饼图的数据和样式: ```javascript mounted() { const chartDom = document.getElementById('chart'); // 假设有一个id为'chart'的DOM元素用于显示图表 const myChart = echarts.init(chartDom, 'macarons'); // 初始化Echarts实例,指定主题 const option = { series: [ { type: 'pie', radius: ['50%', '70%'], // 控制内外半径大小 label: { show: true, position: 'inside', formatter: '{b}: {c}', }, data: [ { value: 335, name: '数据1' }, { value: 310, name: '数据2' }, { value: 234, name: '数据3' }, { value: 135, name: '数据4' }, { value: 1548, name: '数据5' }, ], }, ], }; myChart.setOption(option); // 设置图表配置项 // 可选:在窗口大小变化时重新绘制图表 window.addEventListener('resize', () => { myChart.resize(); }); } ``` 4. 在Vue组件的模板中,添加用于显示图表的DOM元素: ```html <template> <div id="chart" style="width: 100%; height: 400px;"></div> </template> ``` 这样,您就可以在Vue项目中使用Echarts绘制立体环形饼图了。记得在Vue组件销毁时销毁Echarts实例,可以在`beforeDestroy`生命周期钩子函数中调用`myChart.dispose()`。 希望对您有所帮助!如果还有其他问题,请随时提问。
评论
添加红包

请填写红包祝福语或标题

红包个数最小为10个

红包金额最低5元

当前余额3.43前往充值 >
需支付:10.00
成就一亿技术人!
领取后你会自动成为博主和红包主的粉丝 规则
hope_wisdom
发出的红包
实付
使用余额支付
点击重新获取
扫码支付
钱包余额 0

抵扣说明:

1.余额是钱包充值的虚拟货币,按照1:1的比例进行支付金额的抵扣。
2.余额无法直接购买下载,可以购买VIP、付费专栏及课程。

余额充值