


目录:
1.图像的导出
2.plot()/_linspace() 取点/legend(‘L1’,‘L2’…)
3.subplot()
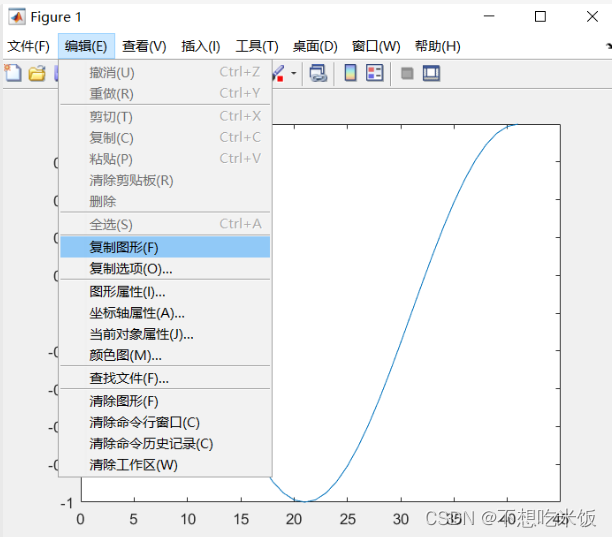
1.图像的导出
①选择直接复制图形,即可把图像复制到Word里
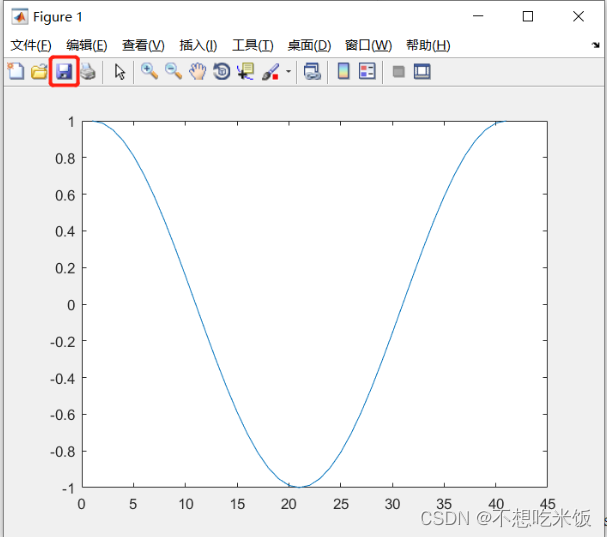
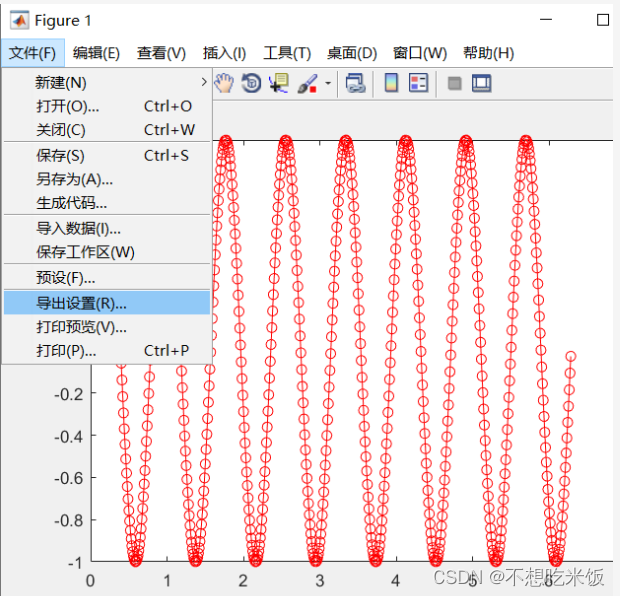
②使用保存按钮,一般将图像保存成.png格式
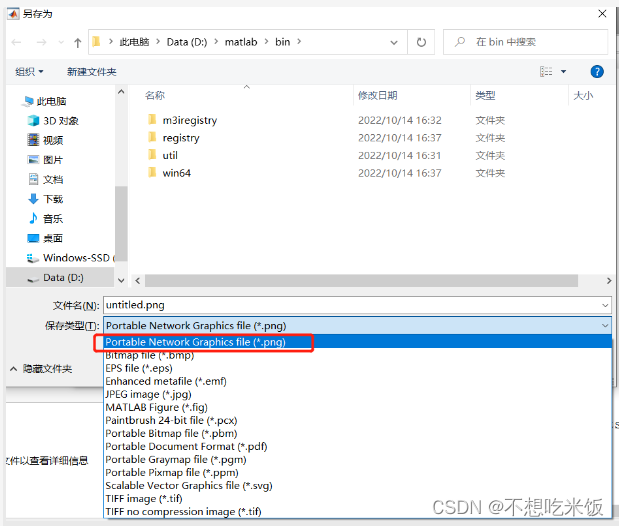
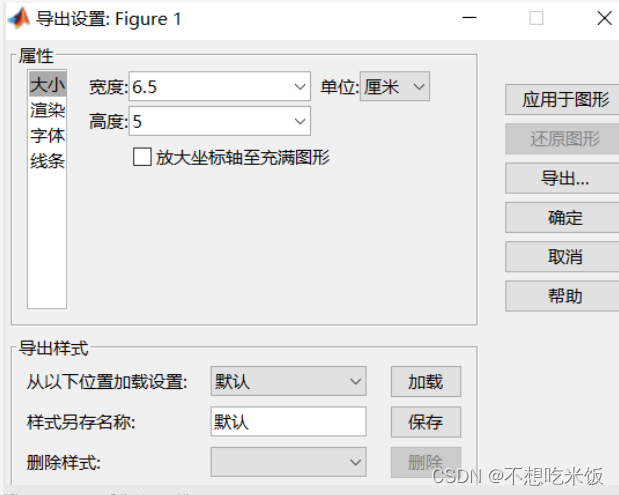
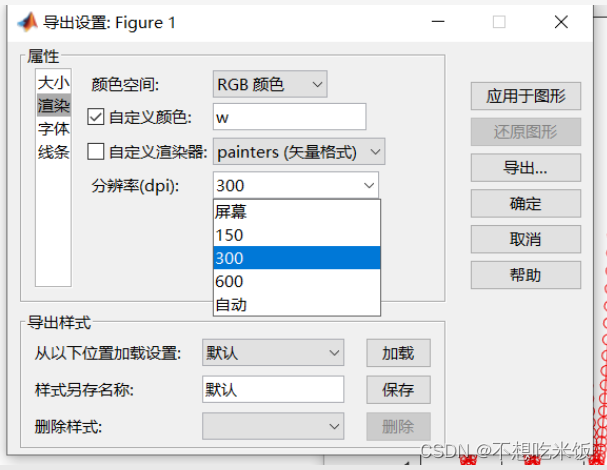
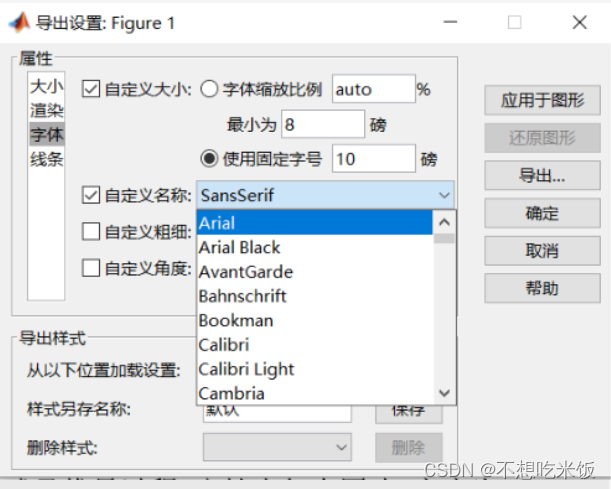
③ 对导出图像属性进行设置
如图片宽高、图片分辨率、字体等
2.plot()
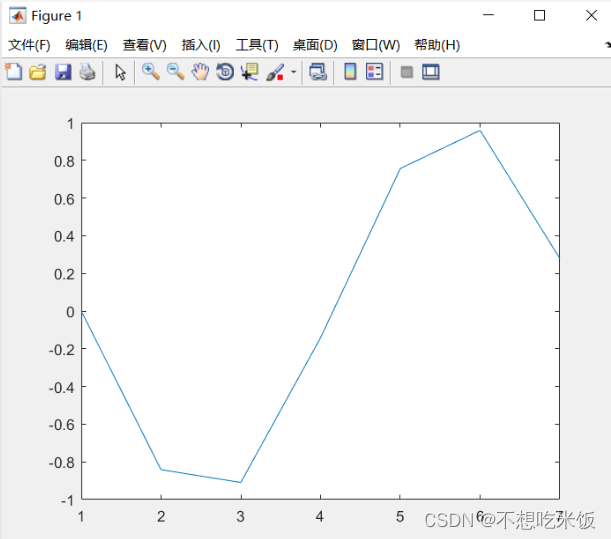
Ⅰ.plot(y):不给x,则默认x轴坐标为1 2 3 …
例:
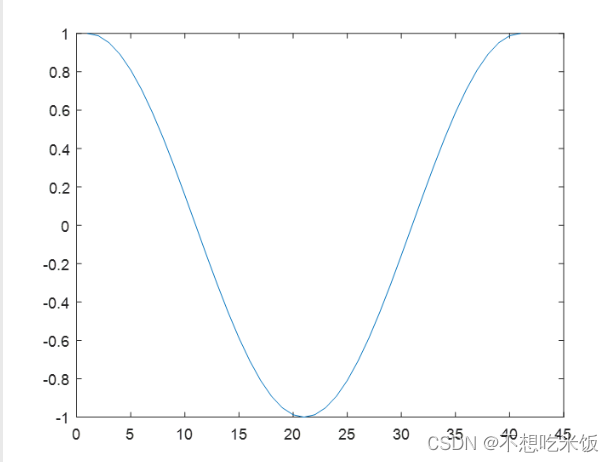
>> plot(sin(-pi:pi))
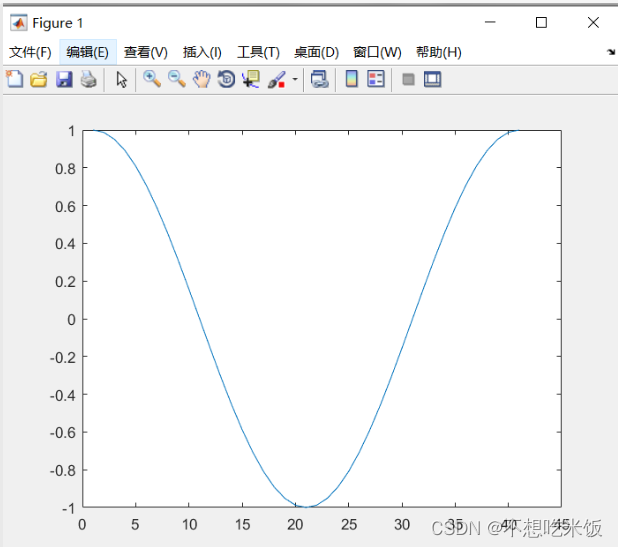
>> plot(cos(0:pi/20:2*pi))
plot(x,y):初始
plot(x,y,‘str’):给予画出的线条三种属性

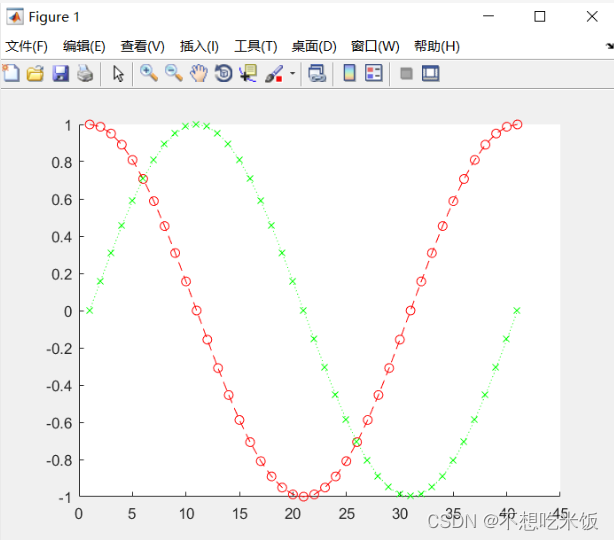
例: 用legend(‘L1’,‘L2’…)文字说明
%%
hold on;
plot(cos(0:pi/20:2*pi),'or--');
plot(sin(0:pi/20:2*pi),'xg:');
hold off;
%%
x = 0:0.5:4*pi;
y = sin(x);
h = cos(x);
w = 1./(1+exp(-x));
g = (1/(2*pi*2)^0.5).*exp((-1.*(x-2*pi).^2)./(2*2^2));
plot(x,y,'bd-',x,h,'gp:',x,w,'ro-',x,g,'c^-');
legend('sin(x)','cos(x)','Sigmoid','Gauss function');

linspace() 取点
x = linspace(x1,x2) 返回包含 x1 和 x2 之间的 100 个等间距点的行向量。
y = linspace(x1,x2,n) 生成 n 个点。这些点的间距为 (x2-x1)/(n-1)。
annotation(‘linetype’,x,y)
lineType 指定为 line(线条)、arrow(箭头) 或 doublearrow(双向箭头).
x 和 y 分别为 [x_begin, x_end] 和 [y_begin, y_end] 形式的向量.
text()中 向数据点添加文本说明
text(x,y,txt) 前两个参数是说明在图中的起始位置
第3个参数是 latex 语句字符串,后两个是使用 latex 语法添加说明时的固有格式。
title(‘’)/xlabel(‘’)/ylabel(‘’)/zlabel(‘’)
%%
x = linspace(0,3);
y = x.^2.*sin(x);
plot(x,y);
line([2,2],[0,2^2*sin(2)]);
str = '$$\int_{0}^{2} x^2\sin(x) dx $$ ';
text(0.25,2.5,str,'Interpreter','latex');
annotation('arrow','X',[0.32,0.5],'Y',[0.6,0.4]);
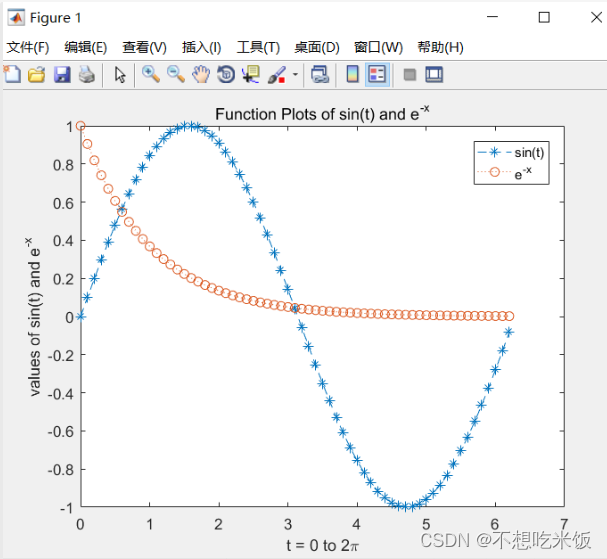
%%
x = 0:0.1:2*pi;
y1 = sin(x);
y2 = exp(-x);
plot(x,y1,'--*',x,y2,':o');
xlabel('t = 0 to 2\pi');
ylabel('values of sin(t) and e^{-x}');
title('Function Plots of sin(t) and e^{-x}');
legend('sin(t)','e^{-x}');
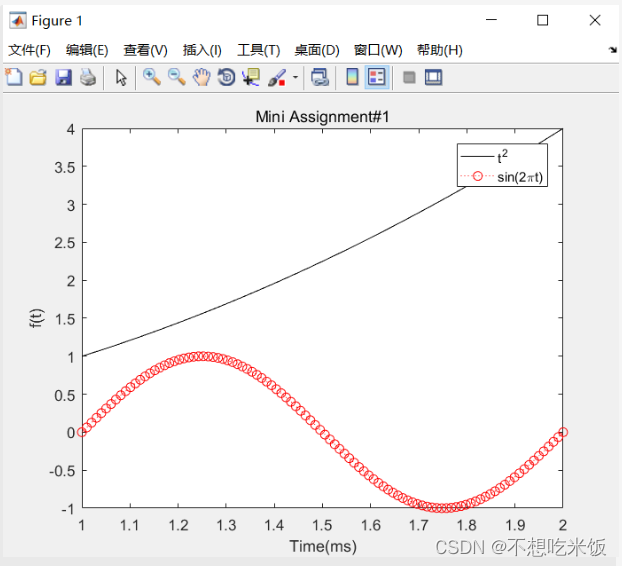
%%
t = linspace(1,2);
f = t.^2;
g = sin(2*pi*t);
plot(t,f,'k-',t,g,'ro:');
title('Mini Assignment#1');
ylabel('f(t)');
xlabel('Time(ms)');
legend('t^2','sin(2\pit)');

3.设置数轴的字体和刻度
h = plot(x,y)将图像handle赋给h
get(h)获取这些handle的信息
set()设置这些handle
gca :数轴(axes)的handle
gcf :图像(figure)的handle
x = linspace(0,2*pi,1000);
y = sin(x);
plot(x,y);
% h = plot(x,y);
% get(h);
% get(gca);
set(gca,'XLim',[0,2*pi]);
set(gca,'YLim',[-1.2,1.2]);
set(gca,'FontSize',25);%字号 font字体

set(gca,'XTick',0:pi/2:2*pi);%设置x轴有五个点0、pi/2、pi、\\
set(gca,'XTickLabel',0:90:360);

set(gca,'XTickLabel',{'0','\pi/2','\pi','3\pi/2','2\pi'});
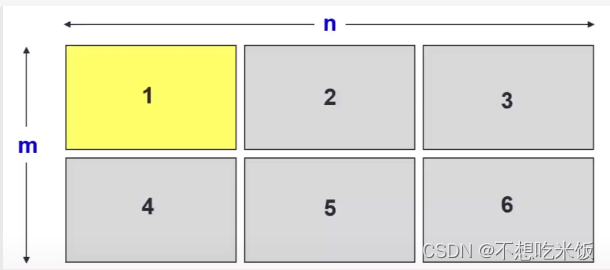
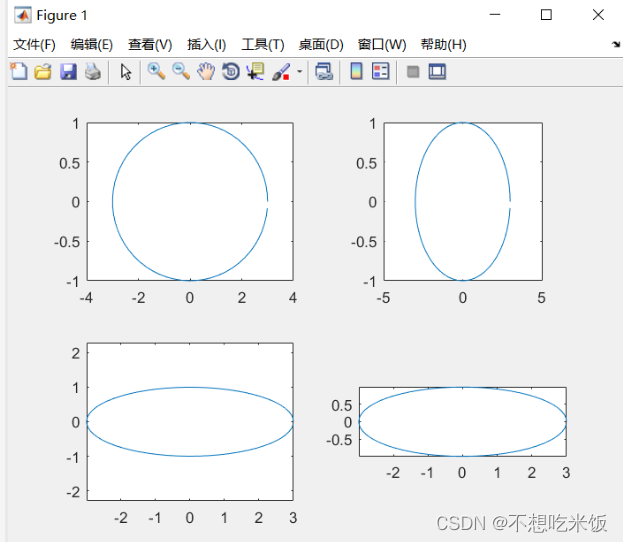
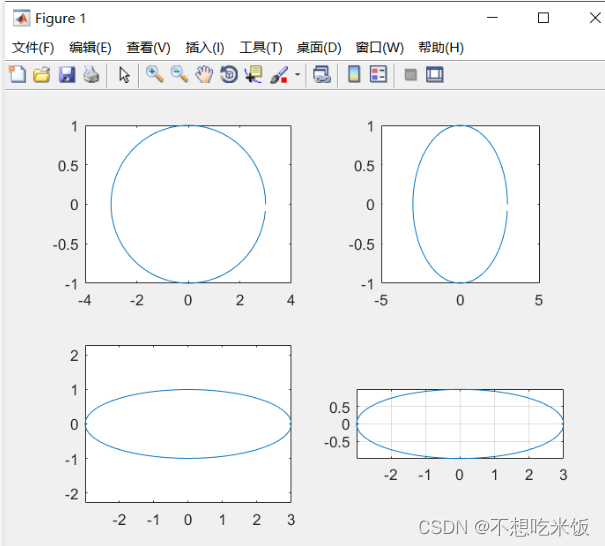
Ⅲ.
多子图绘制 :subplot(m,n,1);
t = 0:0.1:2*pi;
x = 3*cos(t);
y = sin(t);
subplot(2,2,1);plot(x,y);axis normal;
subplot(2,2,2);plot(x,y);axis square;
subplot(2,2,3);plot(x,y);axis equal;
subplot(2,2,4);plot(x,y);axis equal tight;
%%
grid on;
图像欺骗:
在subplot()中你只能对最后一个图像进行操作


 2536
2536


 被折叠的 条评论
为什么被折叠?
被折叠的 条评论
为什么被折叠?
 到【灌水乐园】发言


