


题目:用Matlab绘制一段音频信号在时域上的波形图,然后用低通滤波器滤掉噪音并再次绘制
1、导入音频文件
filename = 'X:\1.mp3'; % 替换为你的音频文件路径
[x, Fs] = audioread(filename);
2、获取音频信号长度
len = length(x);3、计算时间轴
t = (0:len-1) / Fs;4、绘制音频信号在时域上的波形图
figure;
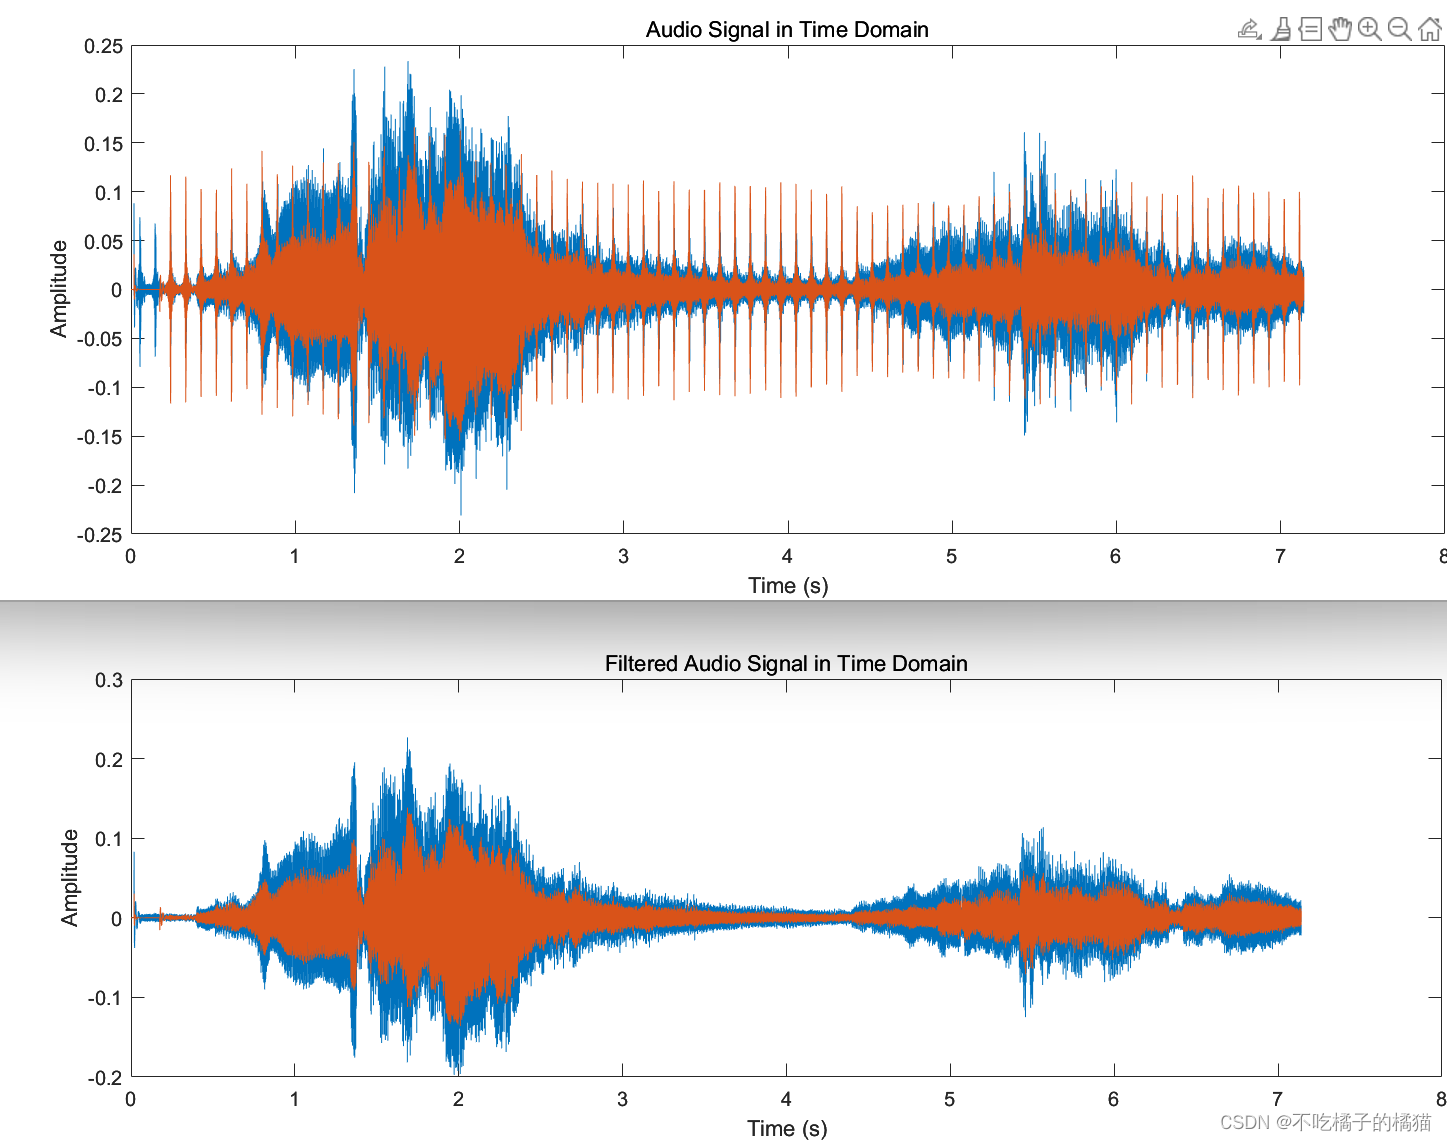
plot(t, x);
xlabel('Time (s)');
ylabel('Amplitude');
title('Audio Signal in Time Domain');5、设计并应用低通滤波器
cutoff_frequency = 2600; % 截止频率为2600 Hz
normalized_cutoff = cutoff_frequency / (Fs/2);
order = 8; % 滤波器阶数
[b, a] = butter(order, normalized_cutoff, 'low');

filtered_x = filter(b, a, x);
6、绘制滤波后的音频信号在时域上的波形图
subplot(2,1,2);
plot(t, filtered_x);
xlabel('Time (s)');
ylabel('Amplitude');
title('Filtered Audio Signal in Time Domain');
总:
% 导入音频文件
filename = 'C:\Users\ahiii\Desktop\1.mp3'; % 替换为你的音频文件路径
[x, Fs] = audioread(filename);

% 获取音频信号长度
len = length(x);

% 计算时间轴
t = (0:len-1) / Fs;

% 绘制音频信号在时域上的波形图
figure;
plot(t, x);
xlabel('Time (s)');
ylabel('Amplitude');
title('Audio Signal in Time Domain');

% 设计低通滤波器
cutoff_frequency = 2600; % 截止频率为2600 Hz
normalized_cutoff = cutoff_frequency / (Fs/2);
order = 8; % 滤波器阶数
[b, a] = butter(order, normalized_cutoff, 'low');

% 应用低通滤波器
filtered_x = filter(b, a, x);

% 绘制滤波后的音频信号在时域上的波形图
subplot(2,1,2);
plot(t, filtered_x);
xlabel('Time (s)');
ylabel('Amplitude');
title('Filtered Audio Signal in Time Domain');
效果:
注意事项:
在进行滤波前,音频信号的振幅可能需要标准化,特别是当信号的振幅较大时,滤波后信号的动态范围可能会变化。可以考虑对信号进行归一化处理,以防止溢出或失真。
x = x / max(abs(x)); % 标准化信号


 1594
1594

 被折叠的 条评论
为什么被折叠?
被折叠的 条评论
为什么被折叠?
 到【灌水乐园】发言


