


本文主要参考源代码here
这个是EECBS的源码,可以根据其中的single agent进行改进,最后用了两种形式将我改进的算法实现可视化。注意:源码中的地图原点位于左上角(0,0),可视化的时候需要注意这点,最后生成的path以txt的格式展现,其中的excel是算法的相关各个部分处理时间,可以选用不同的启发式DG、WDG等实现不同的效果。
我的地图也是课题组自己生成的某个地图库,可以看以下上述链接,其中有各种各样的源码地图,最后保存为txt格式
一、matlab
% 载入数据文件
a = load('swapped.txt');
[row, col] = size(a);
b = a;
b(end+1, end+1) = 0; % 扩展数组,增加一个零元素
figure;

% 设置栅格颜色,不改变背景栅格的颜色
colormap([0 0 0; 1 1 1]); % 黑色为障碍物,白色为路径

% 绘制栅格图
pcolor(-0.5:size(a, 2)-0.5, size(a, 1)-0.5:-1:-0.5, b); % 给坐标赋值,+0 起点就是 0
set(gca, 'xtick', 0:10:300, 'ytick', 0:10:190);
axis image xy
axis ij

% 去除网格线
grid off;
shading flat; % 去掉栅格线,平滑颜色过渡

hold on;

% 读取路径文件
filename = 'pathss-agent4.txt';

% 尝试读取整个文件内容
try
    fileContent = fileread(filename);
catch
    error('无法读取文件 %s', filename);
end

% 按行分割文件内容
lines = splitlines(fileContent);

% 初始化存储路径点的 cell 数组
numAgents = length(lines);
paths = cell(numAgents, 1);

% 解析每一行的数据
for i = 1:numAgents
    % 提取路径数据部分
    line = lines{i};

    % 使用正则表达式提取坐标
    tokens = regexp(line, '\((\d+),(\d+)\)', 'tokens');

    % 预分配坐标矩阵
    numPoints = length(tokens);
    points = zeros(numPoints, 2);

    % 将提取的数据转化为矩阵
    for j = 1:numPoints
        points(j, 1) = str2double(tokens{j}{1}); % y 坐标
        points(j, 2) = str2double(tokens{j}{2}); % x 坐标
    end

    % 存储路径
    paths{i} = points;
end

% 生成随机颜色
colors = rand(numAgents, 3);

% 绘制所有机器人的路径
for i = 1:numAgents
    path = paths{i};
    % 绘制每个机器人的路径,使用随机颜色
    plot(path(:,2), path(:,1), 'LineWidth', 1.5, 'Color', colors(i,:));
end

hold off;

% 生成第二个图,显示路径颜色和机器人编号对应关系
figure;

% 每行显示的机器人数量
numPerRow = 25; % 每行显示25个机器人,您可以调整这个值

% 计算总的行数
numRows = ceil(numAgents / numPerRow);

% 创建一个矩阵显示机器人编号和路径颜色的对应关系
for i = 1:numAgents
    % 计算当前机器人的行列位置
    rowIdx = ceil(i / numPerRow);
    colIdx = mod(i - 1, numPerRow) + 1;

    % 绘制每个机器人的小矩形,显示路径颜色
    % 将矩形的长宽缩小为 0.5
    rectangle('Position', [1.5*(colIdx-1), numRows-rowIdx, 0.5, 0.5], 'FaceColor', colors(i,:), 'EdgeColor', 'none');
    hold on;

    % 在小矩形旁边绘制空白矩形并显示机器人编号
    % 空白矩形也缩小为 0.5
    rectangle('Position', [1.5*(colIdx-1) + 0.5, numRows-rowIdx, 0.5, 0.5], 'FaceColor', [1 1 1], 'EdgeColor', 'none');

    % 显示机器人编号,字体大小稍微调整以适应缩小后的矩形
    text(1.5*(colIdx-1) + 0.75, numRows-rowIdx + 0.25, sprintf('Agent %d', i-1), ...
        'HorizontalAlignment', 'center', 'VerticalAlignment', 'middle', 'FontSize', 6, 'FontName', 'New Nomas');
end

% 设置图像的坐标轴
axis([0 numPerRow*1.5 0 numRows]);
set(gca, 'ytick', [], 'xtick', [], 'xlim', [0 numPerRow*1.5], 'ylim', [0 numRows]);

% 添加标题和标签
title('机器人路径颜色与编号的关系');
xlabel('机器人编号');
ylabel('行号');

% 添加颜色条,帮助识别颜色和机器人路径的关系
colorbar;
hold off;

% 生成第三个图,显示起点和终点位置
figure;

% 重新绘制栅格图
pcolor(-0.5:size(a, 2)-0.5, size(a, 1)-0.5:-1:-0.5, b); % 给坐标赋值,+0 起点就是 0
colormap([0 0 0; 1 1 1]);
set(gca, 'xtick', 0:10:300, 'ytick', 0:10:190);
axis image xy
axis ij

% 去除网格线
grid off;
shading flat; % 去掉栅格线,平滑颜色过渡

hold on;

% 绘制起点和终点标记
for i = 1:numAgents
    path = paths{i};

    % 检查路径是否为空
    if ~isempty(path)
        % 绘制起点,小圆点
        plot(path(1,2), path(1,1), 'o', 'MarkerSize', 6, 'MarkerEdgeColor', colors(i,:), 'MarkerFaceColor', colors(i,:));

        % 绘制终点,小圆点
        plot(path(end,2), path(end,1), 'o', 'MarkerSize', 6, 'MarkerEdgeColor', colors(i,:), 'MarkerFaceColor', colors(i,:));
    end
end

% 添加标题
title('机器人起点与终点位置');
xlabel('X坐标');
ylabel('Y坐标');
hold off;
二、C#
sing System;
using System.Collections.Generic;
using System.Drawing;
using System.IO;
using System.Linq;
using System.Windows.Forms;
namespace WinForms3
{
public partial class Form1 : Form
{
private List<List<char>> mapData = new List<List<char>>(); // 地图数据
private Dictionary<int, List<Point>> agentPaths = new Dictionary<int, List<Point>>(); // 机器人路径
private int currentStep = 0; // 当前时间步
private int totalSteps = 0; // 最大时间步数
private System.Windows.Forms.Timer timer; // 定时器
private Bitmap mapBitmap; // 缓存的地图位图
private float scaleFactor = 1.0f; // 缩放因子
private int cellSize = 20; // 单元格大小(默认大小)
public Form1()
{
InitializeComponent();
// 初始化定时器
timer = new System.Windows.Forms.Timer();
timer.Interval = 500; // 每500ms更新一次
timer.Tick += Timer_Tick;
}
private void btnLoadMap_Click(object sender, EventArgs e)
{
using (OpenFileDialog openFileDialog = new OpenFileDialog())
{
openFileDialog.Filter = "Text Files (*.txt)|*.txt";
if (openFileDialog.ShowDialog() == DialogResult.OK)
{
string[] lines = File.ReadAllLines(openFileDialog.FileName);
mapData = lines.Select(line => line.ToList()).ToList();
// 绘制静态地图到位图
CreateMapBitmap();
// 动态计算缩放因子
UpdateScaleFactor();
pnlDrawing.Invalidate(); // 重绘
}
}
}
private void btnLoadPaths_Click(object sender, EventArgs e)
{
using (OpenFileDialog openFileDialog = new OpenFileDialog())
{
openFileDialog.Filter = "Text Files (*.txt)|*.txt";
if (openFileDialog.ShowDialog() == DialogResult.OK)
{
string[] lines = File.ReadAllLines(openFileDialog.FileName);
ParsePaths(lines);
// 初始化播放
currentStep = 0;
totalSteps = agentPaths.First().Value.Count;
timer.Start();
}
}
}
private void ParsePaths(string[] lines)
{
agentPaths.Clear();
foreach (var line in lines)
{
var parts = line.Split(':');
if (parts.Length == 2)
{
int agentId = int.Parse(parts[0].Split()[1]);
var coordinates = parts[1].Trim().Split(')');
List<Point> path = new List<Point>();
foreach (var coord in coordinates)
{
if (coord.Contains('('))
{
var point = coord.Trim().Trim('(', ')').Split(',');
int y = int.Parse(point[0]); // 第一个是 Y 坐标
int x = int.Parse(point[1]); // 第二个是 X 坐标
path.Add(new Point(x, y)); // 转换为 (X, Y) 格式
}
}
agentPaths[agentId] = path;
}
}
}
private void Timer_Tick(object sender, EventArgs e)
{
currentStep++;
if (currentStep >= totalSteps)
{
timer.Stop();
}
pnlDrawing.Invalidate(); // 刷新绘图
}
private void pnlDrawing_Paint(object sender, PaintEventArgs e)
{
Graphics g = e.Graphics;
g.Clear(Color.White);
g.ScaleTransform(scaleFactor, scaleFactor);
// 绘制静态地图
if (mapBitmap != null)
{
g.DrawImage(mapBitmap, 0, 0);
}
// 绘制动态机器人路径
if (agentPaths.Count > 0)
{
foreach (var agent in agentPaths)
{
int agentId = agent.Key;
if (currentStep < agent.Value.Count)
{
Point position = agent.Value[currentStep];
// 坐标系变换:绘图 Y = 地图高度 - 路径 Y - 1
int x = position.X;
int y = mapData.Count - position.Y - 1;
if (x < 0 || x >= mapData[0].Count || y < 0 || y >= mapData.Count)
{
Console.WriteLine($"Agent {agentId} has out-of-bound path: ({x}, {y})");
continue;
}
Brush brush = new SolidBrush(Color.FromArgb((agentId * 50) % 255, (agentId * 80) % 255, (agentId * 110) % 255));
g.FillEllipse(brush, x * cellSize, y * cellSize, cellSize, cellSize);
}
}
}
}
private void CreateMapBitmap()
{
int mapWidth = mapData[0].Count * cellSize;
int mapHeight = mapData.Count * cellSize;
mapBitmap = new Bitmap(mapWidth, mapHeight);
using (Graphics g = Graphics.FromImage(mapBitmap))
{
for (int row = 0; row < mapData.Count; row++)
{
for (int col = 0; col < mapData[row].Count; col++)
{
int drawY = mapData.Count - row - 1; // Y 坐标翻转
if (mapData[row][col] == '@')
{
g.FillRectangle(Brushes.Black, col * cellSize, drawY * cellSize, cellSize, cellSize);
}
else
{
g.FillRectangle(Brushes.White, col * cellSize, drawY * cellSize, cellSize, cellSize);
g.DrawRectangle(Pens.Gray, col * cellSize, drawY * cellSize, cellSize, cellSize);
}
}
}
}
}
private void UpdateScaleFactor()
{
if (mapData.Count == 0 || mapData[0].Count == 0)
return;
float scaleX = pnlDrawing.Width / (float)(mapData[0].Count * cellSize);
float scaleY = pnlDrawing.Height / (float)(mapData.Count * cellSize);
scaleFactor = Math.Min(scaleX, scaleY);
}
private void Form1_Resize(object sender, EventArgs e)
{
UpdateScaleFactor();
pnlDrawing.Invalidate(); // 窗口大小调整后重绘
}
}
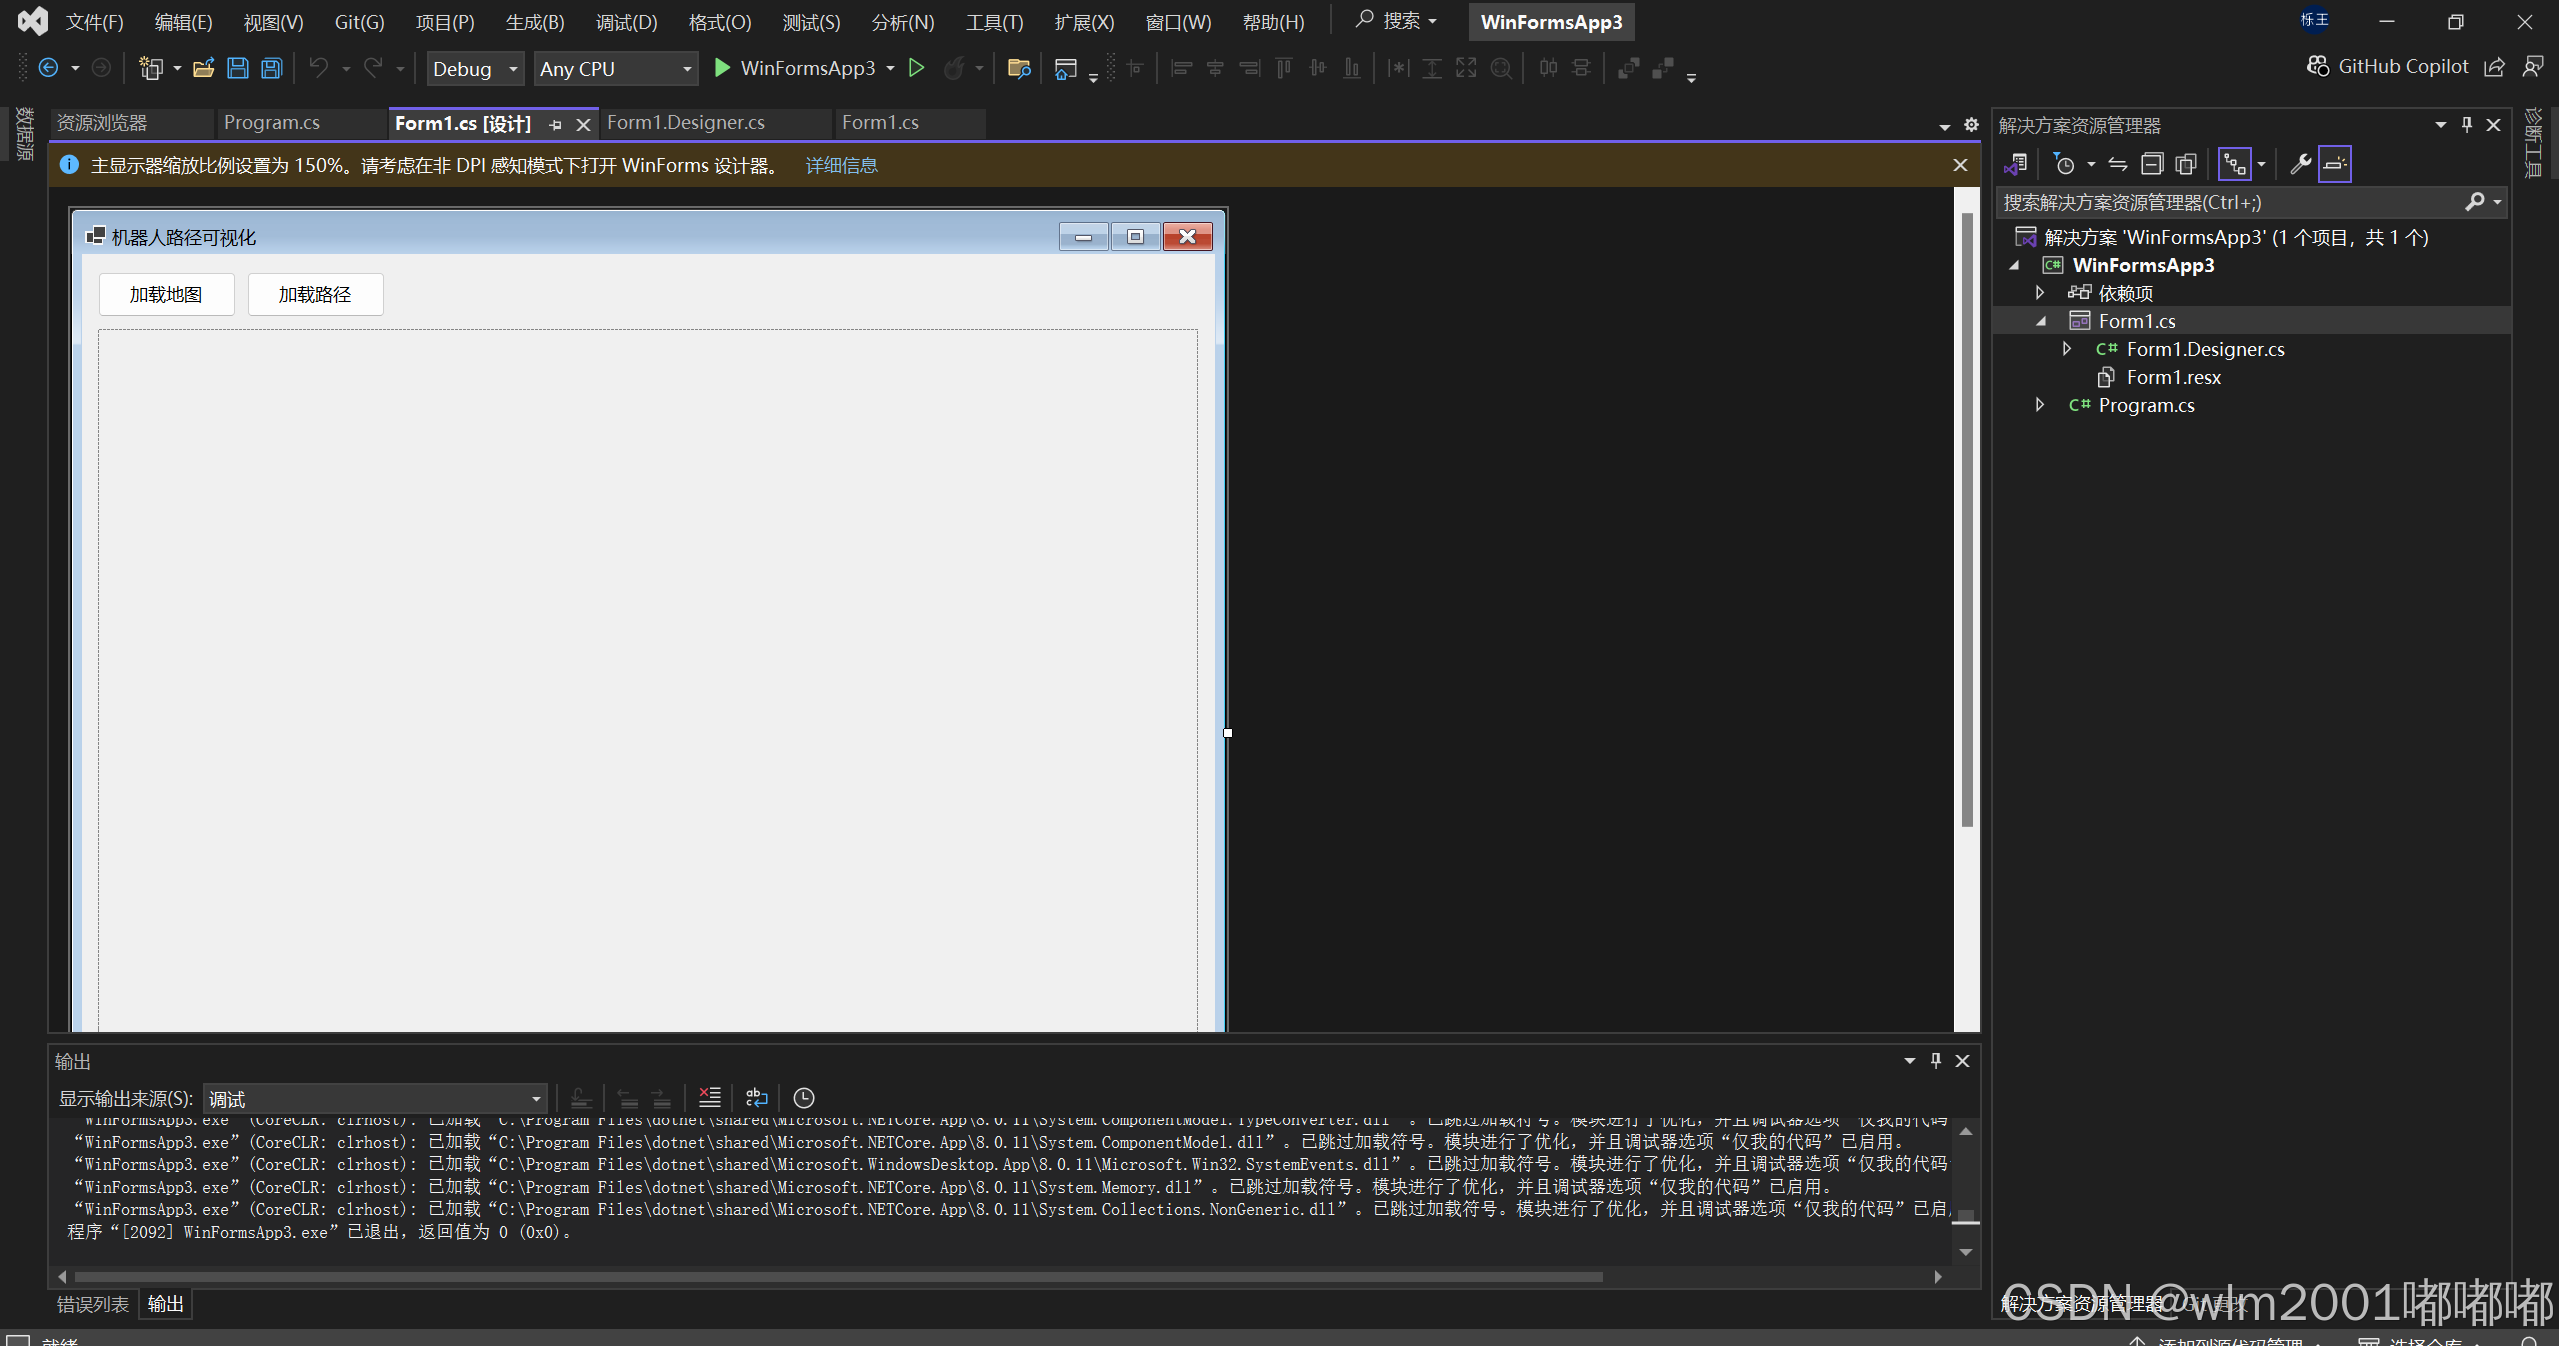
}最后生成的界面效果如下
另外,放上500台机器人仿真调度的结果,C#界面做的太小了,就不放了
500台机器人的路径规划


 1368
1368

 被折叠的 条评论
为什么被折叠?
被折叠的 条评论
为什么被折叠?
 到【灌水乐园】发言


