


关于智能优化算法的文章,80%以上会在文章里介绍经典的CEC测试集函数,然而请问在写文章的时候必须得用这个CEC函数集的函数吗?
回答是:NO!
当你的文章是将改进的智能算法用于实际工程案例的时候,不宜使用过大的篇幅介绍改进的智能算法,因为你还得讲清楚改进的算法用于实际案例时效果如何。
此时怎么解决呢?小淘在查阅了很多论文发现,很多聪明的作者会简单地将智能算法只在几种单峰函数和多峰函数进行比较。这样既能说明清楚改进智能算法的优势,还能控制篇幅。
本篇文章总结常用的47种经典测试函数,有些是在CEC函数集能找到,有些是找不到的。函数集的来源网址:http://www.sfu.ca/~ssurjano/optimization.html
这里只总结常用的CEC函数集!点击这个网址可以看到,一共47种。
这个网址中有非常多的测试函数集,基本上常用的不常用的全在里边了!而且每个函数都有公式说明和对应的理论最小值。简单截几张图:
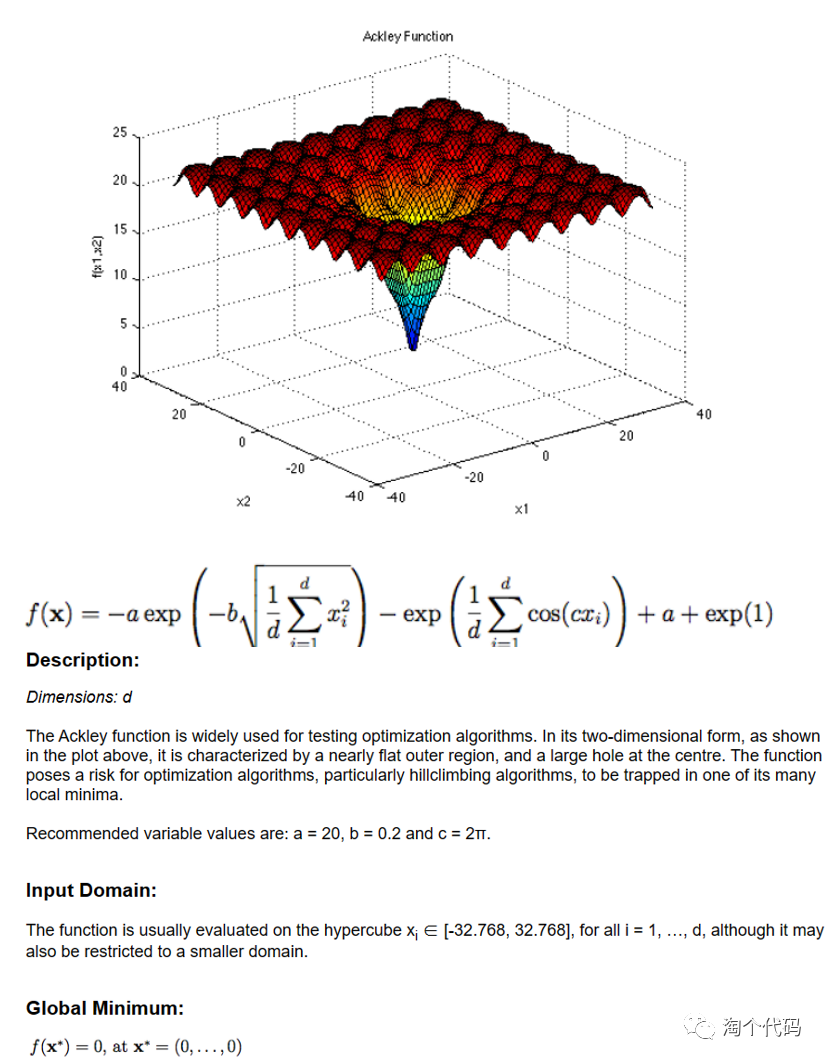
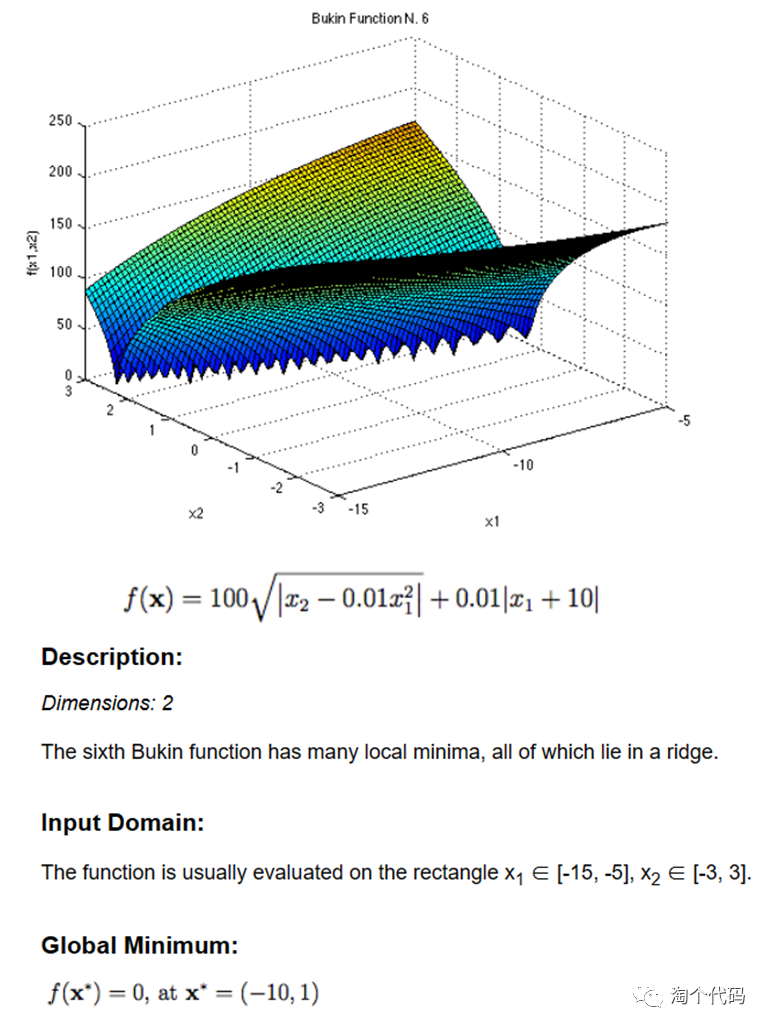
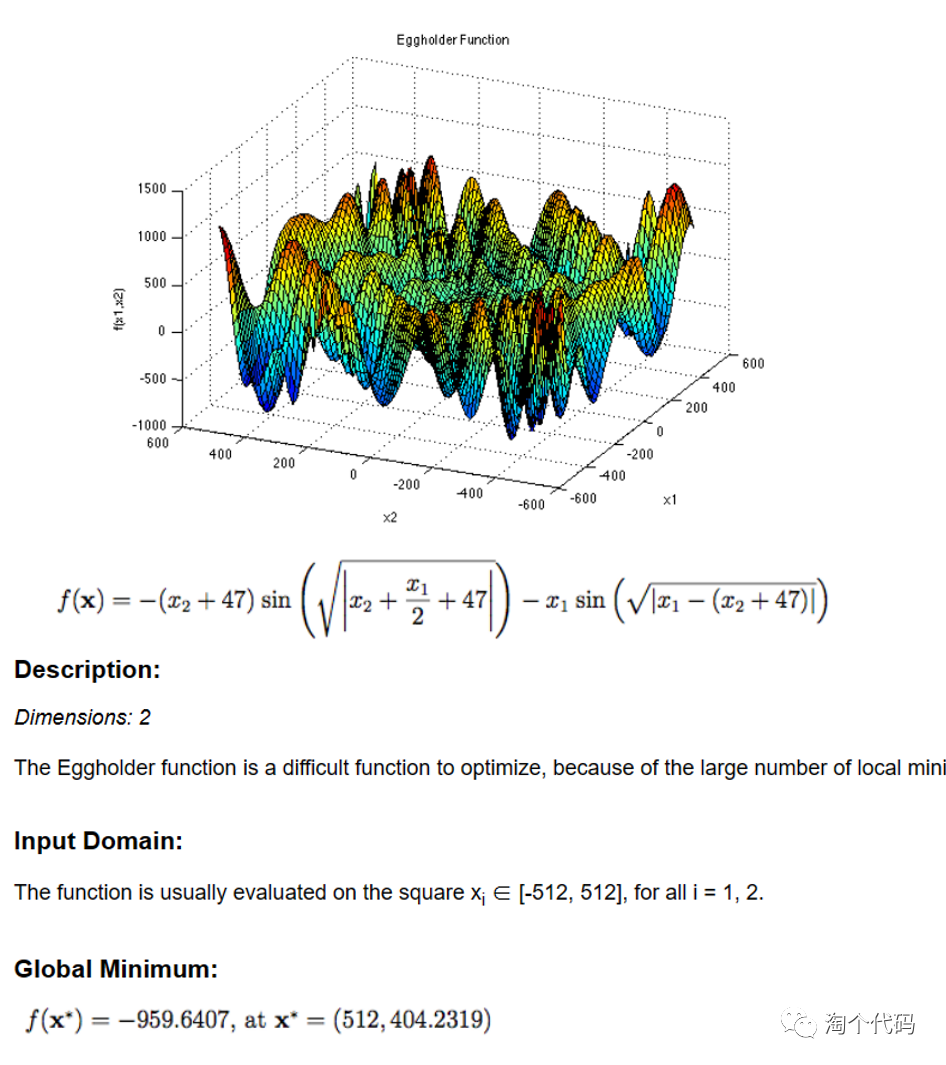
可以看到,不仅有图片绘制,详细公式,还有理论值,最佳值位置,自变量范围等。这不妥妥的科研宝藏网站!
本篇文章要做的事情就是:复现这些图形,用matlab跑出来,并将47个函数整理成集合,方便智能算法像调用CEC测试集一样调用每个函数!
话不多说,先看结果!
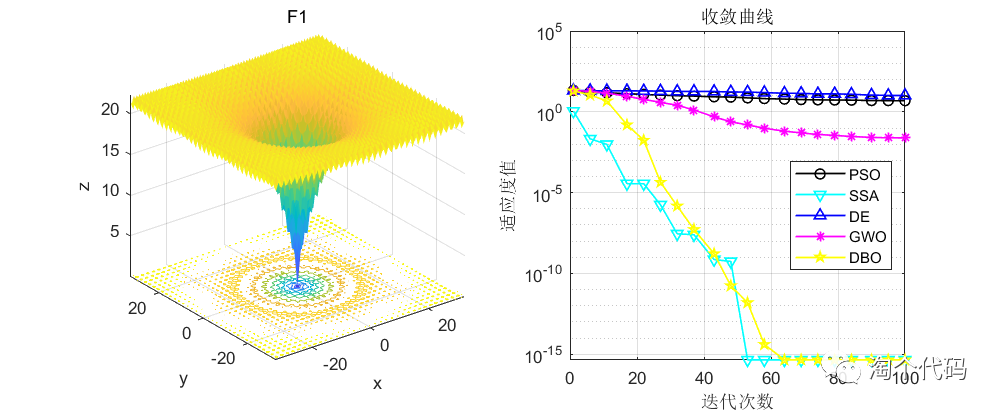
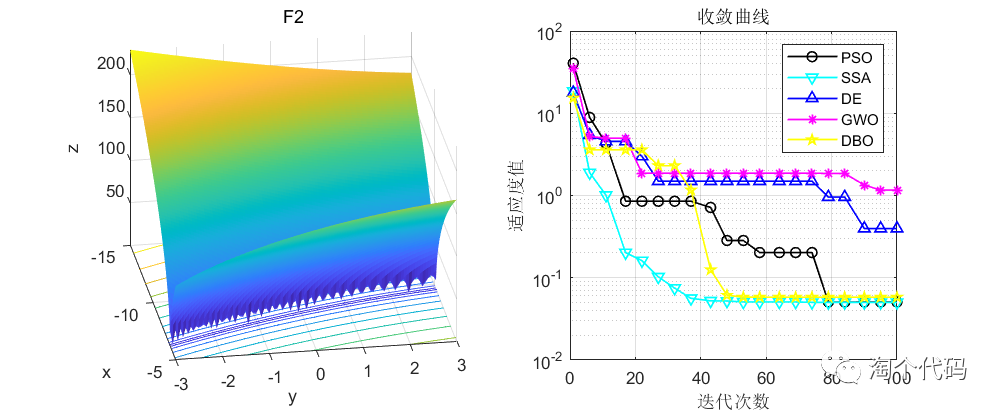
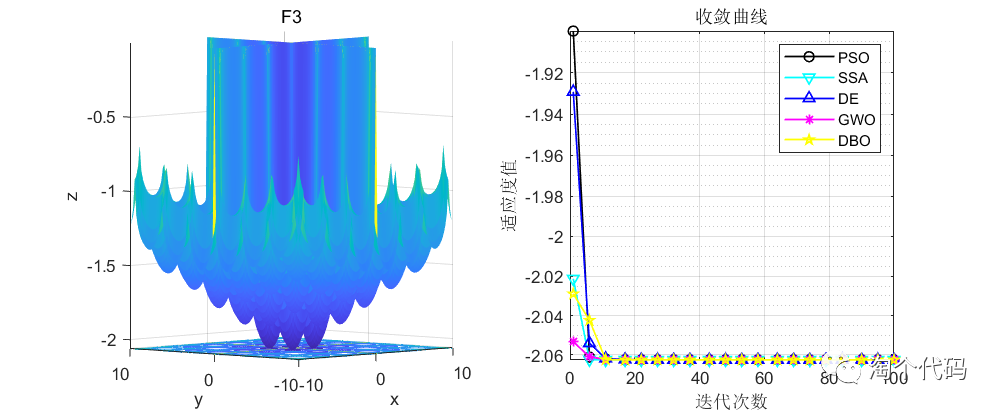
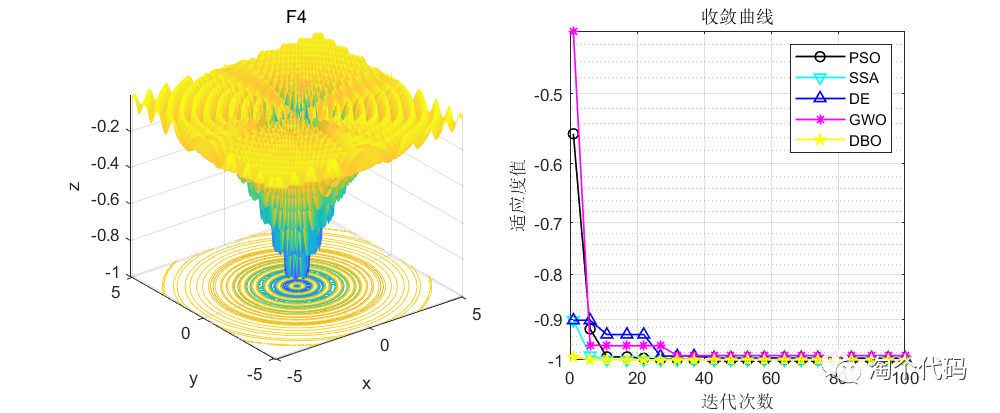
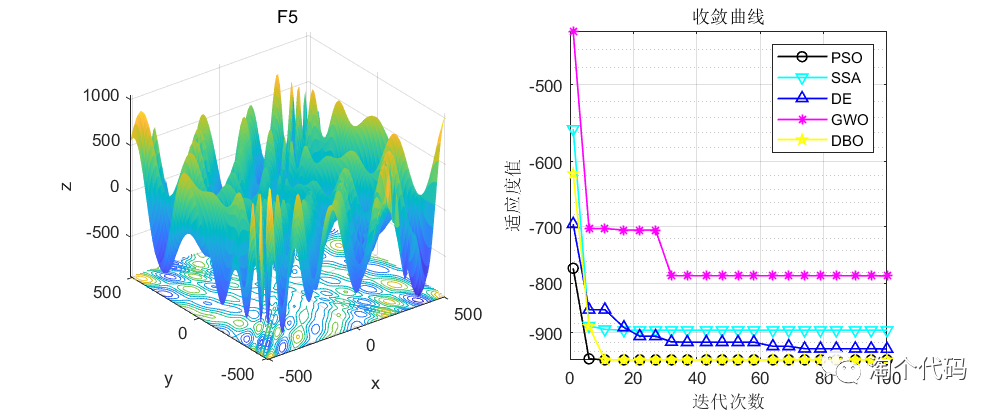
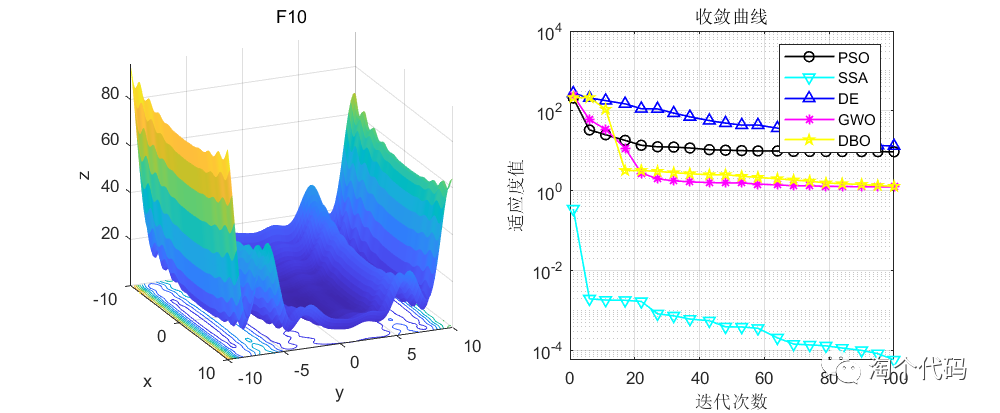
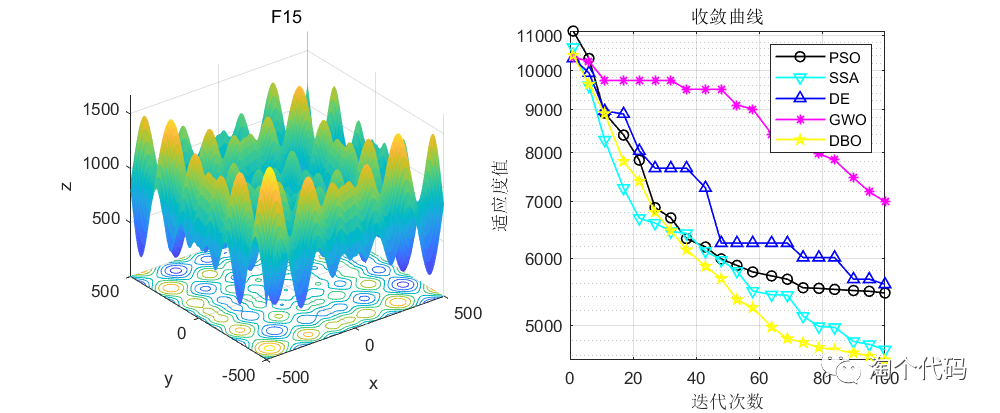
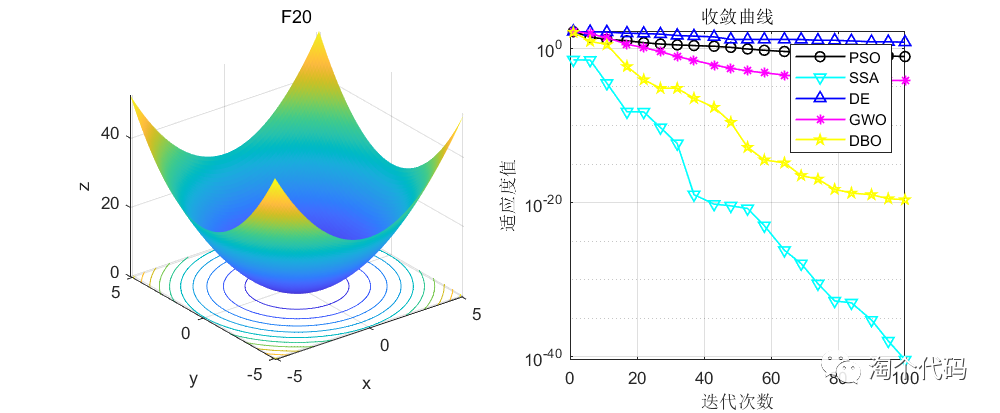
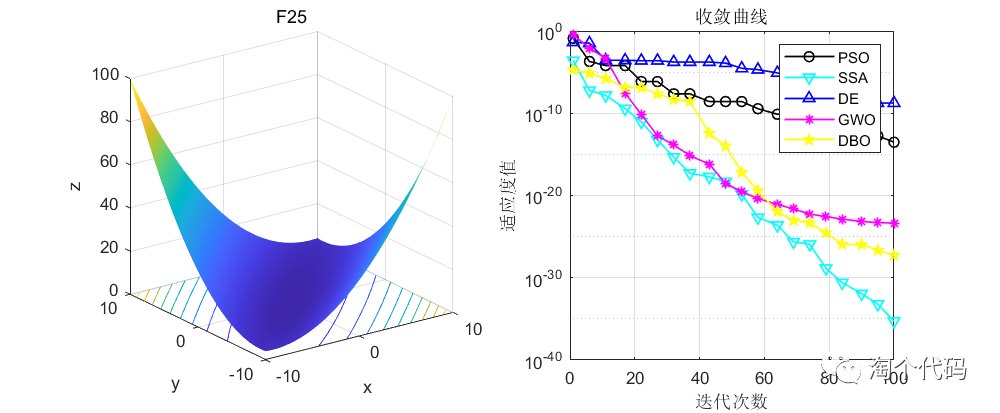
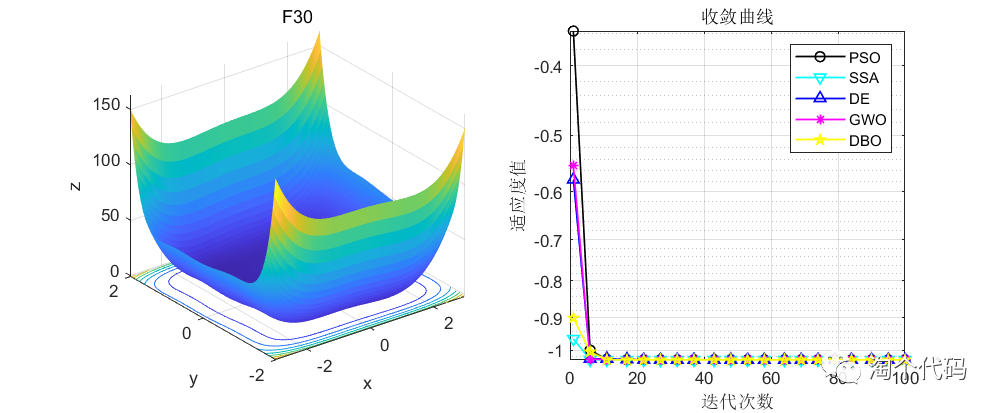
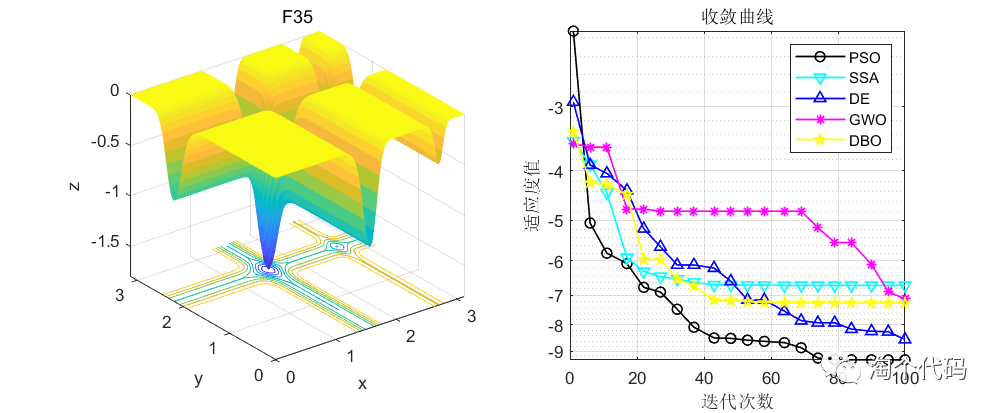
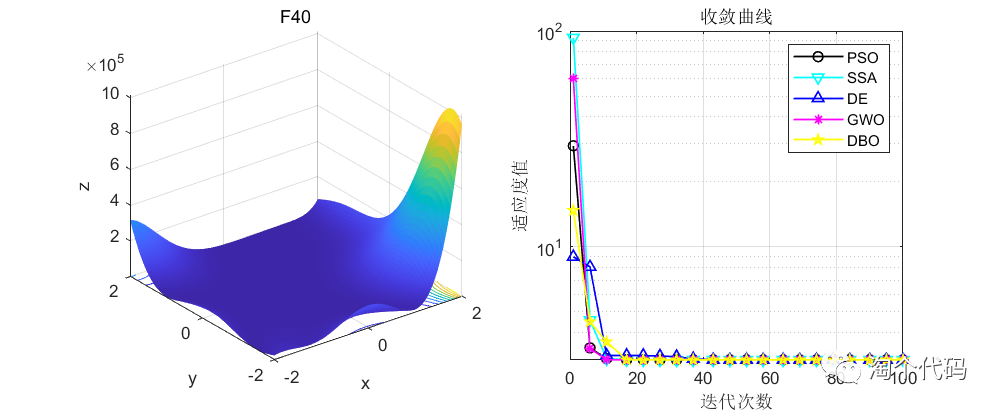
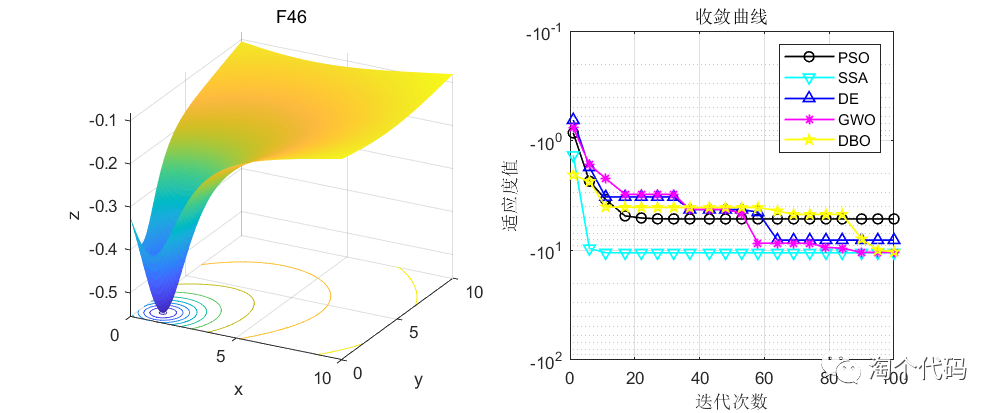
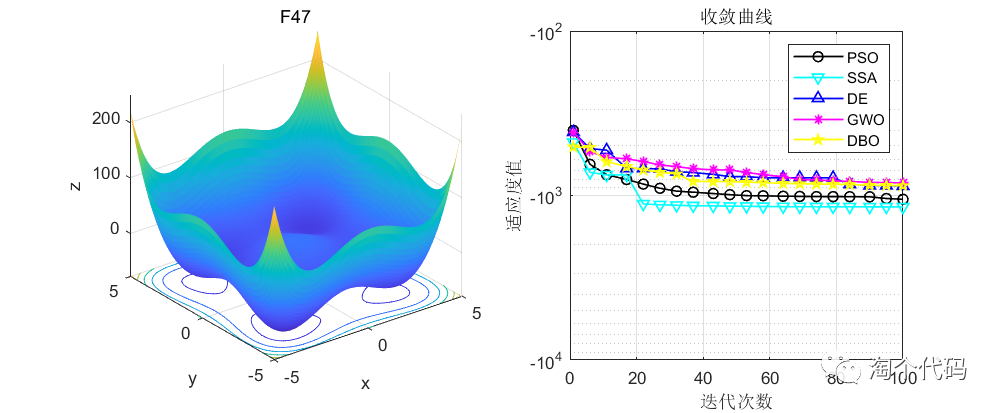
由于篇幅原因,这里就给大家截这么一些图,其他图片都可以复现,且可以直接采用智能算法调用!
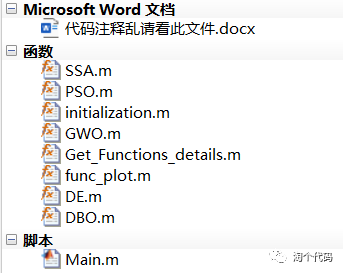
代码展示
clear
clc
close all
warning off
addpath(genpath(pwd));
number='F1'; %选定优化函数,自行替换:F1~F47
[lower_bound,upper_bound,variables_no,fobj]=Get_Functions_details(number);  % [lb,ub,D,y]:下界、上界、维度、目标函数表达式
pop_size=30;                      % population members
max_iter=100;                  % maximum number of iteration
%% PSO
[PSO_Best_score,~,PSO_curve]=PSO(pop_size,max_iter,lower_bound,upper_bound,variables_no,fobj);  % Calculating the solution of the given problem using PSO
display(['The best optimal value of the objective funciton found by PSO  for ' [num2str(number)],'  is : ', num2str(PSO_Best_score)]);
%% SSA
[SSA_Best_score,~,SSA_curve]=SSA(pop_size,max_iter,lower_bound,upper_bound,variables_no,fobj);  % Calculating the solution of the given problem using SSA
display(['The best optimal value of the objective funciton found by SSA  for ' [num2str(number)],'  is : ', num2str(SSA_Best_score)]);
%% DE
[DE_Best_score,~,DE_curve]=DE(pop_size,max_iter,lower_bound,upper_bound,variables_no,fobj);
display(['The best optimal value of the objective funciton found by DE  for ' [num2str(number)],'  is : ', num2str(DE_Best_score)]);
%% GWO
[GWO_Best_score,~,GWO_curve]=GWO(pop_size,max_iter,lower_bound,upper_bound,variables_no,fobj);
display(['The best optimal value of the objective funciton found by GWO  for ' [num2str(number)],'  is : ', num2str(GWO_Best_score)]);
%% DBO
[DBO_Best_score,~,DBO_curve]=DBO(pop_size,max_iter,lower_bound,upper_bound,variables_no,fobj);
display(['The best optimal value of the objective funciton found by DBO  for ' [num2str(number)],'  is : ', num2str(DBO_Best_score)]);
%% Figure
if strcmp(number,'F45')==1
    disp('☆☆☆官方没给F45的图,因此这个三维图请忽略☆☆☆')
end


figure1 = figure('Color',[1 1 1]);
G1=subplot(1,2,1,'Parent',figure1);
func_plot(number)
title(number)
xlabel('x')
ylabel('y')
zlabel('z')
subplot(1,2,2)
G2=subplot(1,2,2,'Parent',figure1);
CNT=20;
k=round(linspace(1,max_iter,CNT)); %随机选CNT个点
% 注意:如果收敛曲线画出来的点很少,随机点很稀疏,说明点取少了,这时应增加取点的数量,100、200、300等,逐渐增加
% 相反,如果收敛曲线上的随机点非常密集,说明点取多了,此时要减少取点数量
iter=1:1:max_iter;
if ~strcmp(number,'F23') &&~strcmp(number,'F26') %这里是因为这几个函数收敛太快,不适用于semilogy,直接plot
    semilogy(iter(k),PSO_curve(k),'k-o','linewidth',1);
    hold on
    semilogy(iter(k),SSA_curve(k),'c-v','linewidth',1);
    hold on
    semilogy(iter(k),DE_curve(k),'b-^','linewidth',1);
    hold on
    semilogy(iter(k),GWO_curve(k),'m-*','linewidth',1);
    hold on
    semilogy(iter(k),DBO_curve(k),'y-p','linewidth',1);


else
   plot(iter(k),PSO_curve(k),'k-o','linewidth',1);
    hold on
    plot(iter(k),SSA_curve(k),'c-v','linewidth',1);
    hold on
    plot(iter(k),DE_curve(k),'b-^','linewidth',1);
    hold on
    plot(iter(k),GWO_curve(k),'m-*','linewidth',1);
    hold on
    plot(iter(k),DBO_curve(k),'y-p','linewidth',1);
end
grid on;
title('收敛曲线')
xlabel('迭代次数');
ylabel('适应度值');
box on
legend('PSO','SSA','DE','GWO','DBO')
set (gcf,'position', [300,300,800,330])
代码目录如下:


 530
530


 被折叠的 条评论
为什么被折叠?
被折叠的 条评论
为什么被折叠?
 到【灌水乐园】发言


