


一、折线图
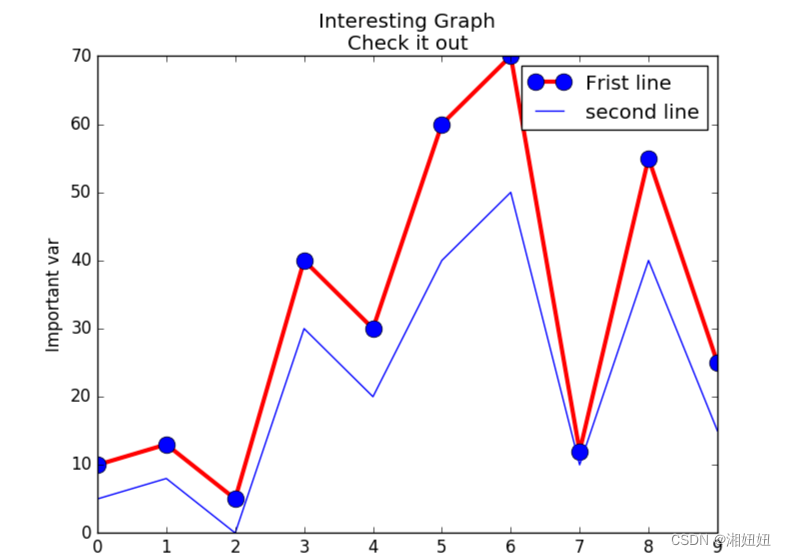
import matplotlib.pyplot as plt
y1=[10,13,5,40,30,60,70,12,55,25]
x1=range(0,10)
x2=range(0,10)
y2=[5,8,0,30,20,40,50,10,40,15]
plt.plot(x1,y1,label='Frist line',linewidth=3,color='r',marker='o',
markerfacecolor='blue',markersize=12)
plt.plot(x2,y2,label='second line')
plt.xlabel('Plot Number')
plt.ylabel('Important var')
plt.title('Interesting Graph\nCheck it out')
plt.legend()
plt.show()
效果展示:
二、条形图
import matplotlib.pyplot as plt
y1=[10,13,5,40,30,60,70,12,55,25]
x1=range(0,20,2)
x2=range(1,21,2)
y2=[5,8,0,30,20,40,50,10,40,15]
plt.bar(x1,y1,label='Frist line')
#plt.bar(x2,y2,label='second line',c
最低0.47元/天 解锁文章


 2174
2174


 被折叠的 条评论
为什么被折叠?
被折叠的 条评论
为什么被折叠?
 到【灌水乐园】发言


