


1.架包:jofc2-1.0-0.jar,xstream-1.3.1.jar
2.js:swfobject.js,jquery-1.7.2.js
3.swf:expressInstall.swf,open-flash-chart.swf
4.页面js:
var flashvars = {"data-file":"${ctx}/queryOrderStatistics.action","loading":"正在分析..."};
var params = {menu: "false",scale: "noScale",wmode:"opaque"};
swfobject.embedSWF("${ctx}/openFlashChat/open-flash-chart.swf", "chart", "1100px", "450px", "9.0.0",
"${ctx}/openFlashChat/expressInstall.swf",flashvars,params); });
5.java代码:
String startTime = (String)getRequest().getParameter("startTime");
String endTime = (String)getRequest().getParameter("endTime");
String shopId = (String)getRequest().getParameter("addShopId");
String flashChatType = (String)getRequest().getParameter("flashChatType");
if ("".equals(startTime)||startTime == null) {
startTime = DateUtil.getSpecifiedDayBefore();
}
if ("".equals(endTime)||endTime == null) {
endTime = new SimpleDateFormat("yyyy-MM-dd").format(new Date());
}
if ("0000000000".equals(shopId)) {
shopId = null;
}
List<String> dayList = DateUtil.dayCount(startTime, endTime);
Map<String, Object> queryMap = new HashMap<String, Object>();
queryMap.put("startTime", startTime+" 00:00:00");
queryMap.put("endTime", endTime+" 23:59:59");
queryMap.put("shopId", shopId);
orderStatisticsList = operateService.selectOrderStatistics(queryMap);
if ("0".equals(flashChatType)) {
List<Number> dataSet = new ArrayList<Number>();
List<Label> xLabel = new ArrayList<Label>();
int maxCount = 0;
for (int i = 0; i < dayList.size(); i++) {
String tip = "0";
for (int j = 0; j < orderStatisticsList.size(); j++) {
if (dayList.get(i).equals(orderStatisticsList.get(j).getTimes())) {
int orderCount = Integer.parseInt(orderStatisticsList.get(j).getCounts());
dataSet.add(orderCount);
xLabel.add(new Label((String) orderStatisticsList.get(j).getTimes()));
tip = "1";
if (orderCount>maxCount) {
maxCount=orderCount;
}
break;
}
}
if ("0".equals(tip)) {
dataSet.add(0);
xLabel.add(new Label((String) dayList.get(i)));
}
}
XAxis labels = new XAxis();
labels.addLabels(xLabel); //设置X轴内容
YAxis range = new YAxis();
range.setRange(0, maxCount+10, 10); //设置Y轴显示值域:Range的三个参数含义为:坐标最小值,最大值和步进值
LineChart lineChart = new LineChart(LineChart.Style.NORMAL);
lineChart.addValues(dataSet);
lineChart.setColour("#6666FF");
lineChart.setText("订单量");
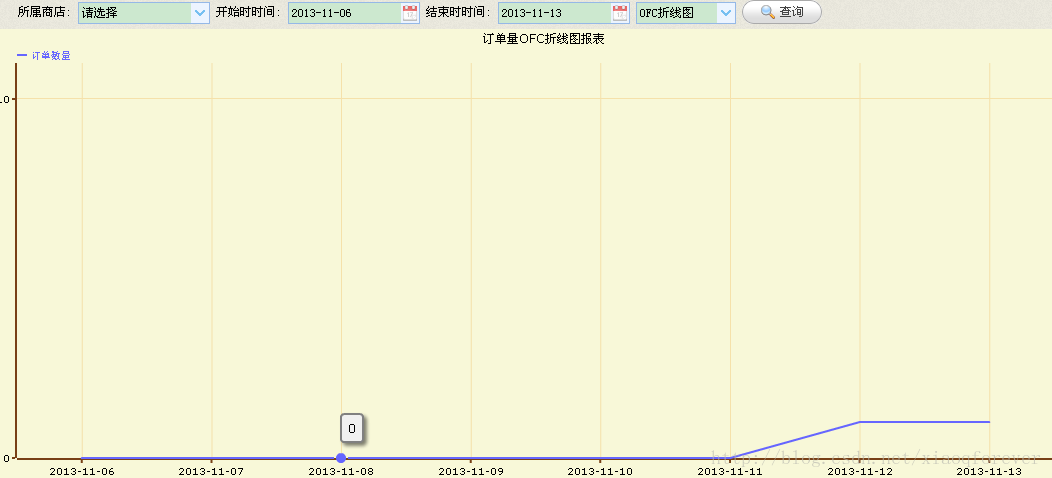
Chart chart = new Chart("订单量OFC折线图报表");
chart.setXAxis(labels);
chart.setYAxis(range);
chart.addElements(lineChart);
JsonUtils.openFlashChat(chart.toString());
return null;


 4770
4770

 被折叠的 条评论
为什么被折叠?
被折叠的 条评论
为什么被折叠?
 到【灌水乐园】发言


