


1. 原理简介
-
在ENVI里面有Linear和Linear2%的线性拉伸的方法,用的最多的就是Linear2%.
-
Linear方法较为简单: g(x,y)=(d - c) / (b - a) * (f(x, y) + c, 其中d和c分别是输出图像的最大值和最小值,b和a分别是原始图像的最大值和最小值,应用上式变换之后将小于c的灰度值赋值为0,大于d的灰度值赋值为255即可。
-
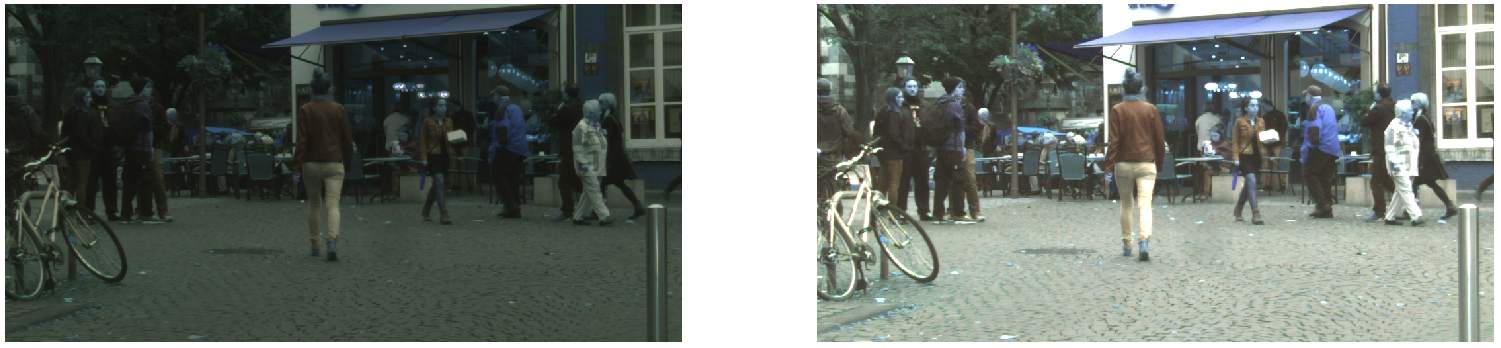
Linear2%方法复杂一点,原理如下:读取原始图像后首先进行直方图统计,进而计算累计直方图,假定截断值为2,然后找到2%对应的灰度值和98%对应的灰度值,将这两个值作为原始图像灰度的最大最小值,运用上述Linear方法即可得到最终结果。
2. python实现
import matplotlib.pyplot as plt
import cv2
import numpy as np

def truncated_linear_stretch(image, truncated_value=2, maxout=255, min_out=0):
    def gray_process(gray, maxout=maxout, minout=min_out):
        truncated_down = np.percentile(gray, truncated_value)
        truncated_up = np.percentile(gray, 100 - truncated_value)
        gray_new = ((maxout - minout) / (truncated_up - truncated_down)) * gray
        gray_new[gray_new < minout] = minout
        gray_new[gray_new > maxout] = maxout
        return np.uint8(gray_new)

    (b, g, r) = cv2.split(image)
    b = gray_process(b)
    g = gray_process(g)
    r = gray_process(r)

    # 合并每一个通道
    result = cv2.merge((b, g, r))
    return result

image = cv2.imread('image1.png')
image_linear2 = truncated_linear_stretch(image)

plt.figure()
plt.subplot(121)
plt.axis('off')
plt.imshow(image)
plt.subplot(122)
plt.axis('off')
plt.imshow(image_linear2)
plt.show()


 被折叠的 条评论
为什么被折叠?
被折叠的 条评论
为什么被折叠?
 到【灌水乐园】发言


