


 本文介绍了如何使用canvas结合接口返回的坐标数据,绘制出精确的路线轨迹图,详细阐述了绘制过程和技术要点。
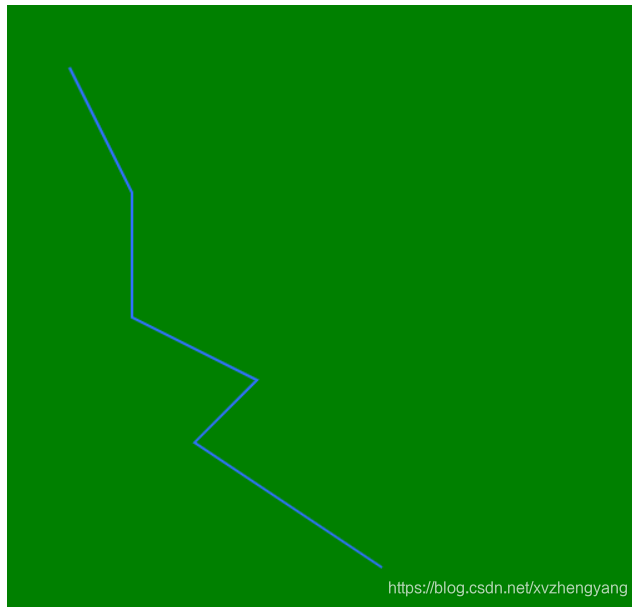
根据接口返回的坐标点位,我们可以将这些左边点位串联起来,形成轨迹图
<!DOCTYPE html>
<html>
	<head>
		<meta charset="utf-8">
		<title>根据返回的坐标,针对当前容器的大小占比</title>
		<style type="text/css">
			.patrol-path {
				position: absolute;
				left: 0;
				top: 0;
				width: 100%;
				height: 100%;
				z-index: 1;
				background-color: #008000;
			}

			.container {
				width: 500px;
				height: 500px;
				background-color: red;
				position: relative;
			}
		</style>
	</head>
	<body>
		<div id="myApp">
			<div class="container" id="container-id">
				<div class="patrol-path">
					<canvas id="canvas" />
				</div>
			</div>
		</div>
		<script type="text/javascript">
			const canvas = document.getElementById('canvas');
			const container = document.getElementById('container-id')
			const {
				clientWidth: containerWidth,
				clientHeight: containerHeight,
			} = container;
			canvas.width = containerWidth;
			canvas.height = containerHeight;
			console.log(`${containerWidth}+容器宽度${containerHeight}`)
			const ctx = canvas.getContext("2d");
			ctx.clearRect(0, 0, containerWidth, containerHeight);
			let pins = [
				[{
						x_axes: 0.1,
						y_axes: 0.1
					},
					{
						x_axes: 0.2,
						y_axes: 0.3
					},
					{
						x_axes: 0.2,
						y_axes: 0.5
					},
					{
						x_axes: 0.4,
						y_axes: 0.6
					},
					{
						x_axes: 0.3,
						y_axes: 0.7
					},
					{
						x_axes: 0.6,
						y_axes: 0.9
					}
				]

			]
			pins.forEach((item, index) => {
				item.forEach((pathItem, pathIndex) => {
					const {
						x_axes: x,
						y_axes: y
					} = pathItem;
					if (pathIndex === 0) {
						ctx.moveTo(containerWidth * x, containerHeight * y);
					} else {
						ctx.lineTo(containerWidth * x, containerHeight * y);
					}
				});
				ctx.lineWidth = 2;
				ctx.strokeStyle = "#3170FF";
				ctx.stroke();
			});
		</script>
	</body>
</html>


 4497
4497

 被折叠的 条评论
为什么被折叠?
被折叠的 条评论
为什么被折叠?
 到【灌水乐园】发言


