


import numpy as np
import cv2
from matplotlib import pyplot as plt

im = cv2.imread('lena.jpg',cv2.CV_LOAD_IMAGE_GRAYSCALE)
plt.imshow(im)
plt.xticks([]),plt.yticks([])
plt.show()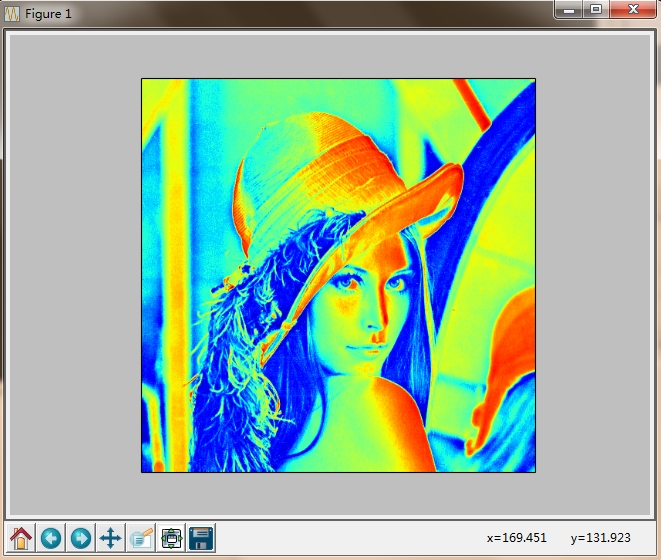
import numpy as np
import cv2
from matplotlib import pyplot as plt
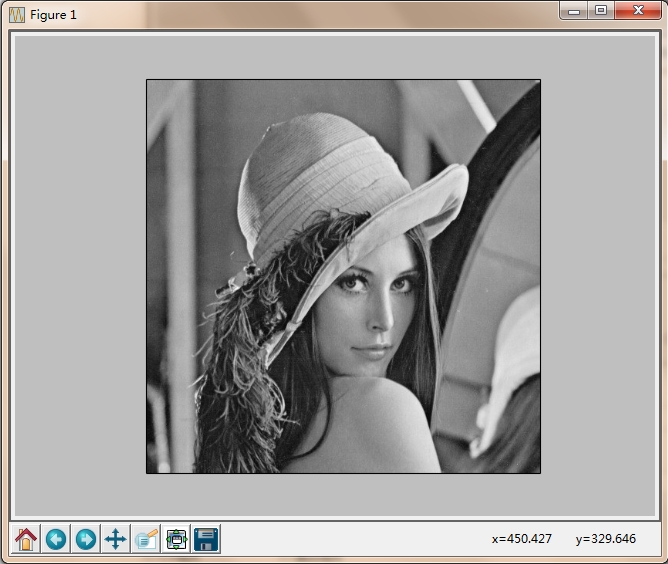
im = cv2.imread('lena.jpg',0)
plt.imshow(im,'gray')
plt.xticks([]),plt.yticks([])
plt.show()
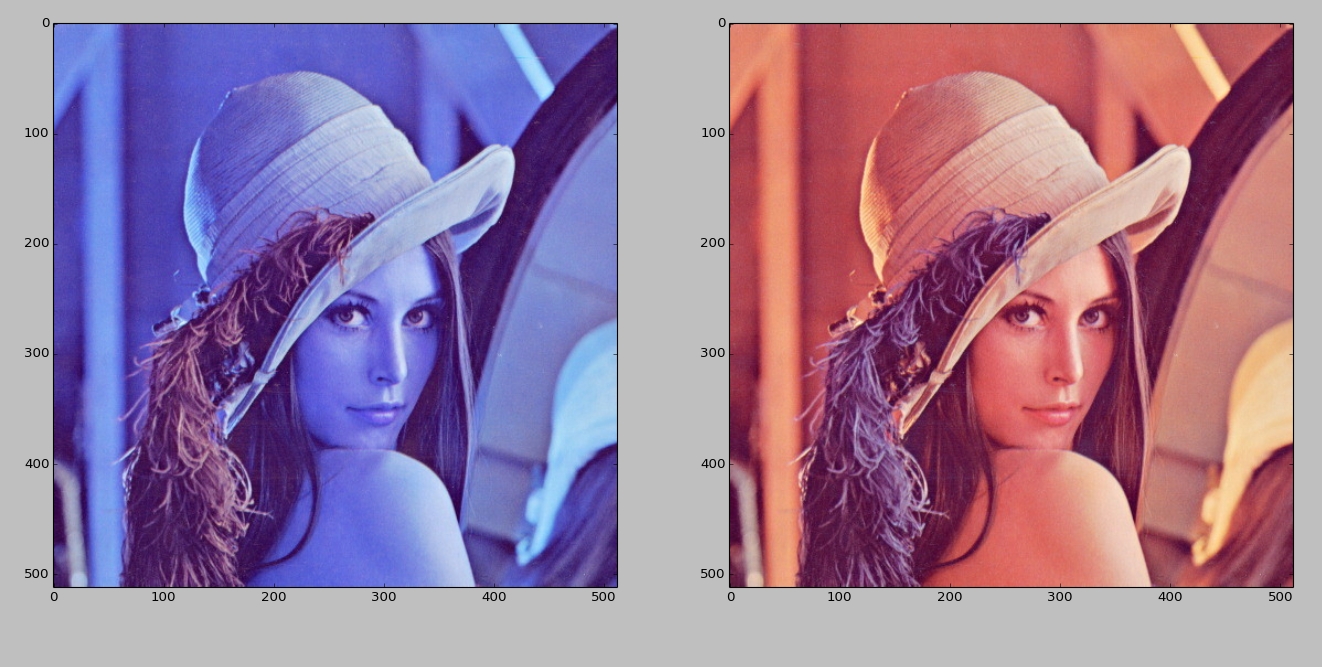
Color image loaded by OpenCV is in BGR mode. But Matplotlib displays in RGB mode. So color
images will not be displayed correctly in Matplotlib if image is read with OpenCV
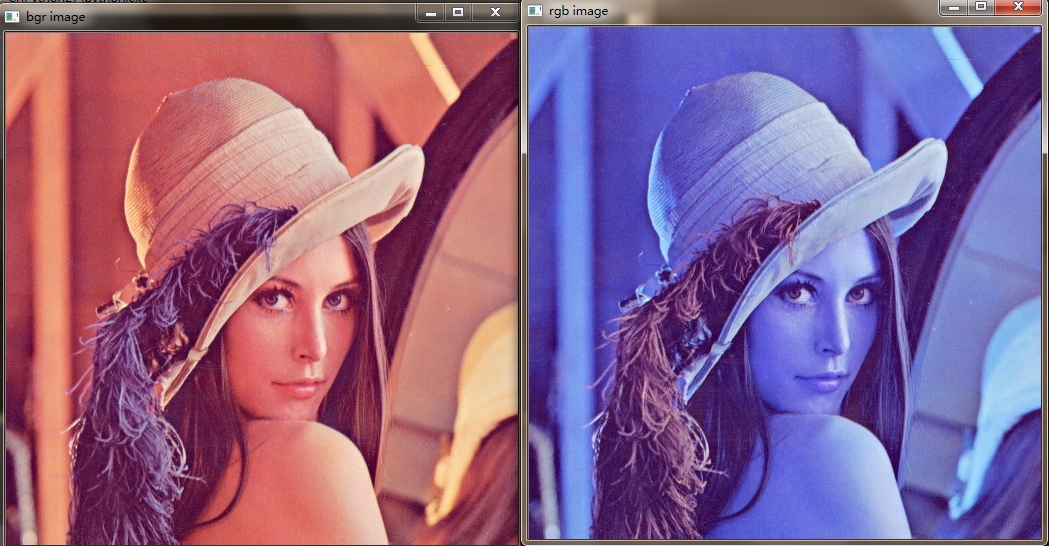
There is a slight difference in pixel ordering in OpenCV and Matplotlib.
OpenCV follows BGR order, while matplotlib likely follows RGB order.
So when you display an image loaded in OpenCV using pylab functions, you may need to convert it into RGB mode. ( I am not sure if any easy method is there). Below method demonstrate it:
Using Matplotlib :
Using OpenCV :


 3156
3156

 被折叠的 条评论
为什么被折叠?
被折叠的 条评论
为什么被折叠?
 到【灌水乐园】发言


