labels =['1','2','3','4','5']
data = [[1,2,3,4,5],[5,6,7,8,9,],[10,11,12,13],[15,16,17,18,19]]
import matplotlib.pyplot as plt
config = {
"font.family":'Times New Roman', # 设置字体类型
"font.size":10
# "mathtext.fontset":'stix',
}
rcParams.update(config)
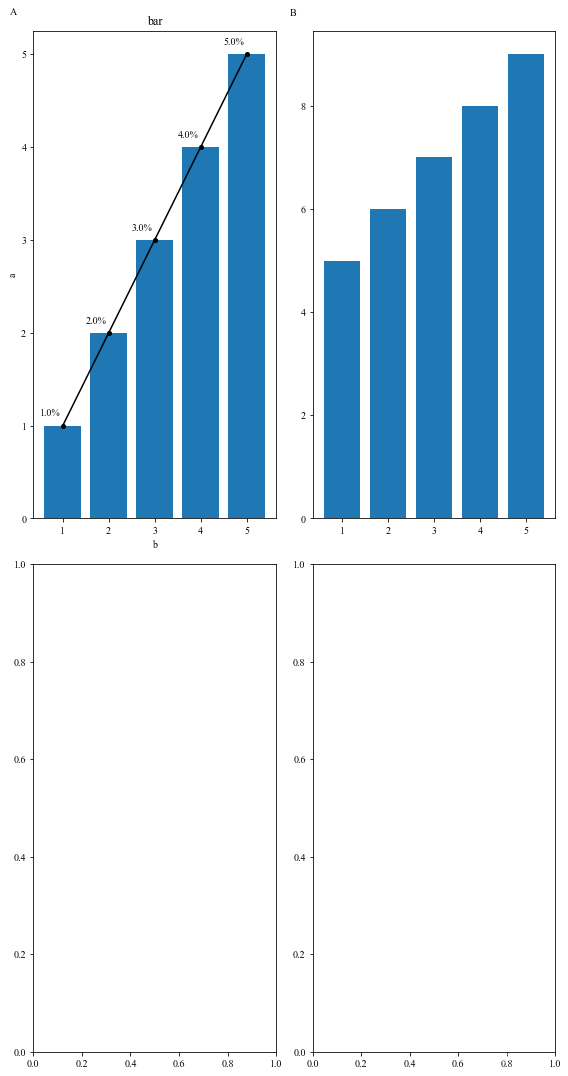
fig, axs = plt.subplots(2, 2, figsize=(8, 15)) #创建一个2*2排列的4个子图,如果想上下一列排列则(4,1)
axs[0,0].bar(labels, data[0]) #axs[0,0] 根据坐标选择哪个子图
axs[0,0].set_ylabel('a') #设置横坐标题
axs[0,0].set_xlabel('b') #设置纵坐标题
axs[0,0].set_title('bar') #设置图标题
axs[0,0].text(-1, 5.4, 'A', va='bottom', ha='right') #根据x,y坐标位置设置图标号A的位置
for i,j in zip(labels,data[0]): #添加数据标签
axs[0,0].text(float(i)-1.5,float(j)+0.1,str('%.1f' % j)+'%') #移动数据标签位置
axs[0,0].plot(labels,data[0],'black',marker='o',markersize=4) #添加数据连接线
#其他子图类似操作
axs[0,1].bar(labels, data[1])
axs[0,1].text(-1, 9.7, 'B', va='bottom', ha='right')
fig.tight_layout()
plt.show()


 3111
3111

 被折叠的 条评论
为什么被折叠?
被折叠的 条评论
为什么被折叠?
 到【灌水乐园】发言


