


参考网址:http://www.cnblogs.com/tornadomeet/archive/2013/03/15/2961660.html
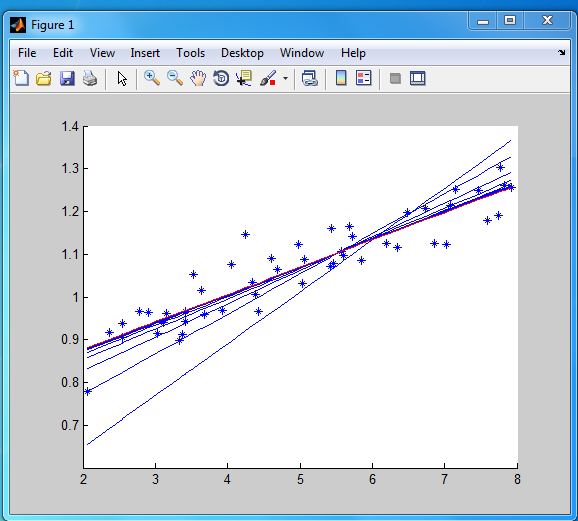
线:
hold on;
plot(x(:,2),y,'*')
plot(x(:,2), x*theta, '-');
plot(x(:,2), x*theta1, 'r-');
hold off;
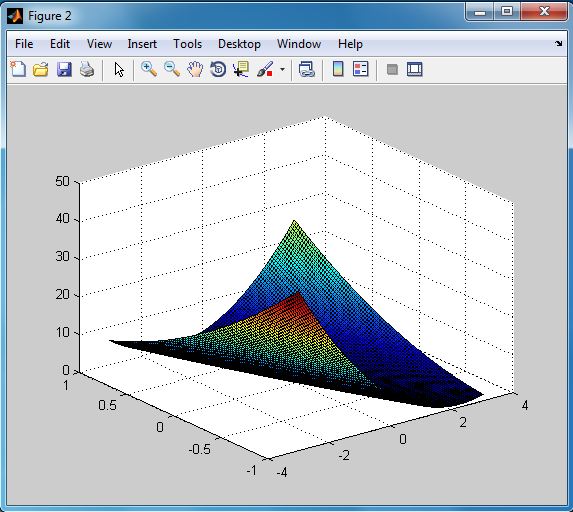
面:
figure;
surf(theta0_vals,theta1_vals,J);
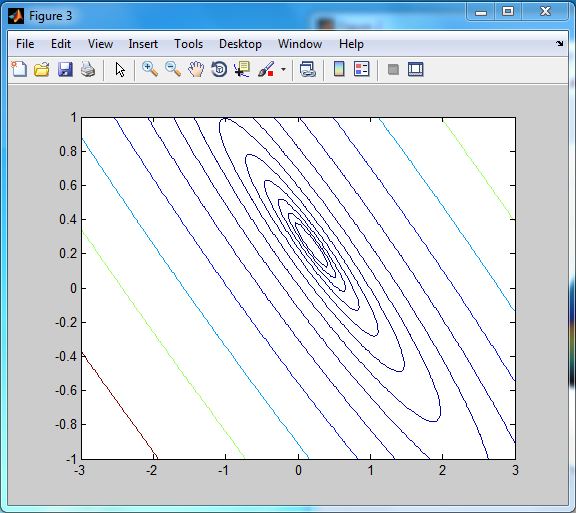
曲线:
figure;
contour(theta0_vals,theta1_vals,J, logspace(-2, 2, 15));


 4302
4302


 被折叠的 条评论
为什么被折叠?
被折叠的 条评论
为什么被折叠?
 到【灌水乐园】发言


