


使用 seaborn lineplot画磁滞回线,自动的给错误排序,加了sort参数也不好用,最后查到国外网站一个例子(可惜一时又搜不到了) 需要增加estimator参数;而且绘制速度更快了
比如,正常可以显示的正弦曲线:
plt.figure(dpi=150)
# here the x values are all unique, and the plot works fine.
xs = np.linspace(0,10,100)
ys = np.sin(xs)
sns.lineplot(x=xs, y=ys)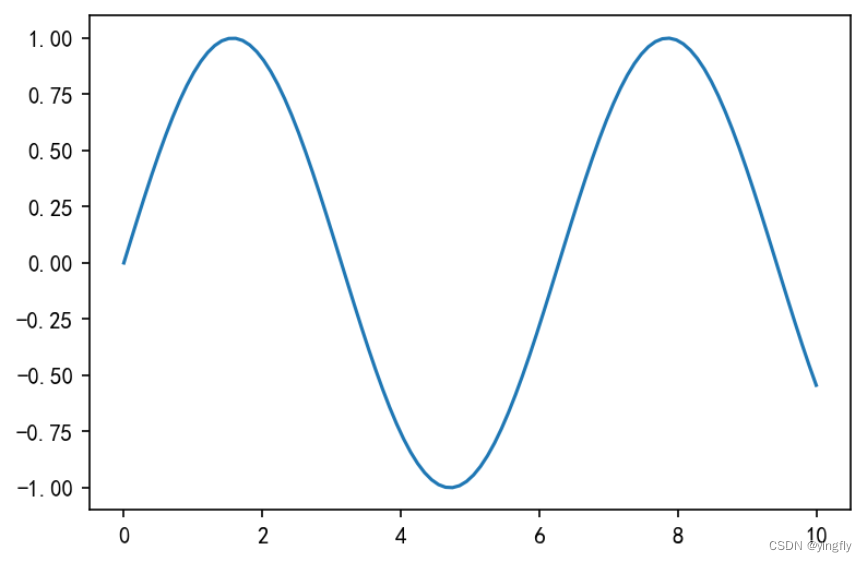
将该曲线的一个数改变,seaborn 自动进行了数据处理,图形明显出现问题:
plt.figure(dpi=150)
xs[6] = xs[46]

sns.lineplot(x=xs, y=ys)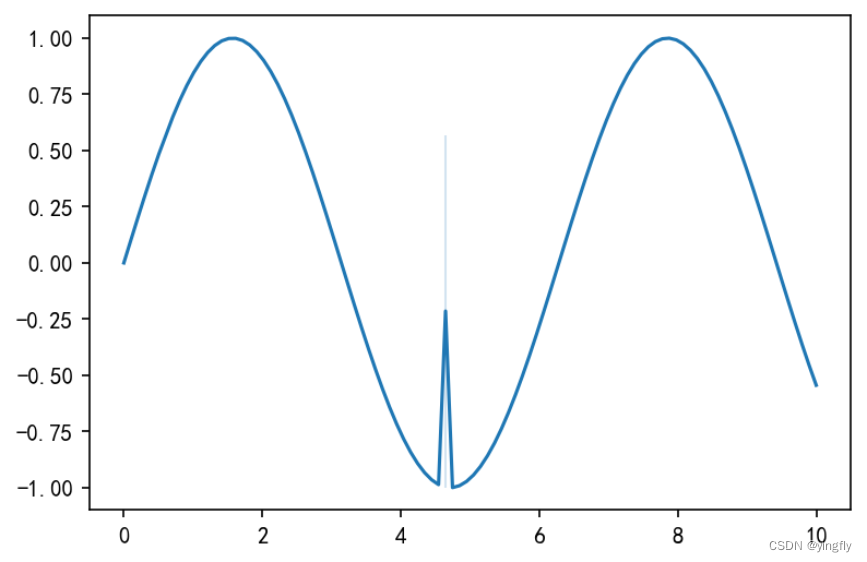
解决方法是加入sort参数与estimate参数:
plt.figure(dpi=150)
sns.lineplot(x=xs, y=ys, sort=False,estimator=None)
sns.scatterplot(x=xs,y=ys)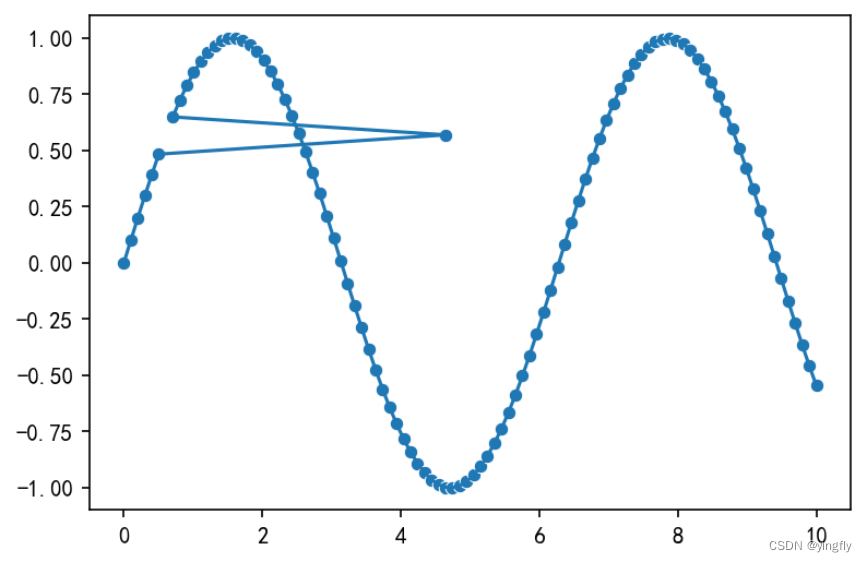


 1891
1891

 被折叠的 条评论
为什么被折叠?
被折叠的 条评论
为什么被折叠?
 到【灌水乐园】发言


