


什么是聚类
Clustering partitions unlabeled data into subsets
聚类就是把数据分入子集,但是这些子集一开始不像分类Classification一样有确定的类。
但是聚类和分类还是很类似的,所以聚类也叫无监督的分类unsupervised classification。也就是说,一开始没有确定的类属(supervised),分完才知道。
分出来的组很可能不是所需要的分类方式,比如我要按颜色分这几件衣服分出来的却是按牌子。
这些得出的子集中原本完全独立的数据点,但这些离散的数据点内部应该有相似性。
• The resulting subsets (called clusters) should consist of internally similar, but externally distinctive data points• Various measures of “similarity” and “distinctiveness” of data points(example: Euclidean distance (in continuous spaces))
• Sometimes, such measures rely on subjective designs (e.g. apple, banana, monkey)
相似性是一个模糊的概念,(在连续空间内)可以是几何距离;也可以是一些人为判断的标准
• Various representations of the clusters:– generative (a.k.a. prototypical, distributional, …)
– discriminative
聚类的方法
• Hierarchical
很直观的一个方法,但是需要计算很多距离
– agglomerative (bottom-up)由下向上的凝聚
先决条件: 知道每两个数据点之间的距离
(1) Assume each data point forms a unique cluster把每一个点当做一个类
(2) Find a pair of clusters closest to each other找到最近的两个点(已知全部距离)
(3) Combine these clusters into one cluster凝聚成一个类
(4) Update distance matrix更新现有的距离矩阵
(5) Repeat (2) to (4) until onlyone cluster left, unless some other stopping condition is satisfied earlier
有很多不同的agglomerative方法,主要的区别就在于cluster pair之间如何组合在一起,如何计算包含了多个点的cluster之间的距离:
– smallest distance between any pair of members任意对距离最小
– largest distance between any pair of members任意对距离最大
– distance between the centroids (means)中心距离
– largest distance between any pair of members任意对距离最大
– distance between the centroids (means)中心距离
– divisive (top-down)由上向下的分裂(和agglomerative相反的思路)
(1) Start with one big cluster把全部当做一个类
(2) For each existing cluster, containing more than one data point, find a pair of points which are farthest apart找最远
(3) Select the cluster with a pair of points separated by the greatest distance; select this pair
(4) Create two new clusters: one for each member of the selected pair
(5) Distribute the remaining points of the selected cluster among the two new clusters 把数据点按照相似性分入新的两个聚集
(6) Repeat (2) to (5) until each cluster has exactly one point in it,
unless some stopping condition is satisfied earlier
– spanning trees 生成树
• Instance-based
–K-means
先决条件: A set of unlabeled data points and an assumed number of clusters (K)必须先决定最后有多少个聚类
寻找: Optimal locations of the cluster centers每个cluster最佳的中心
算法:
(1) Guess (or assume) initial locations of cluster centers 随便找一个看的顺眼的中心
(2) For each data point compute its distances to each of the centers计算每一个点到每个中心点距离
(3) Assign the considered point to the nearest center然后就划到那个cluster去
(4) Re-compute locations of the involved centers as means of the assigned data points从新计算每个cluster的中心(所有点的平均)
(5) Repeat (2) to (4) until there are no changes in assignments往复到没有点移动为止
通常状态下k-means可以确保收敛。初始点的选择会有影响:
随机选择k个点或者
找出主坐标轴 然后沿着坐标轴discretize the data into K zones
再或者,先运行k-1的情况,然加一个新的中心,这个中心最大化到现有中心的距离
k-mean计算量还是比较大的,fairly computationally expensive. 需每次重新计算到中心点的距离,但不需要每次更新距离矩阵
对outliers敏感,不过可以由改进 “K-medoids” (中位数)改进
• Density-based
– mixture models
Fit to data a set of (fairly simple and tractable) additive component models. For instance, use Gaussians:
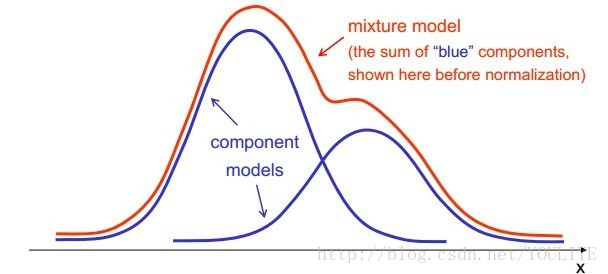
方差和期望,属于某个component的概率是所需要的参数
期望最大化算法可以找出这些参数
Expectation-Maximization Algorithm
EM和K-means的开始类似,但是除了猜测初始的中心点,EM还需要猜测初始的(co)variances和prior probabilities (they can be estimated as relative frequencies of data belonging to each cluster)E-step of the E-M procedure:
– 根据已有的高斯参数,可以计算出数据点属于某一个高斯分布的期望
Given the current values of Gaussians’ parameters we may compute our expectation of how likely it is for each of the data points to belong to each of the Gaussians
(此处和K-means不同,现在每一个点可以数据多个cluster,只要每个%加合为1就可以)
(此处和K-means不同,现在每一个点可以数据多个cluster,只要每个%加合为1就可以)
the M-step:
–根据最大的概率来计算新的高斯参数
We compute new estimates of the Gaussians’ parameters which maximizethe likelihood of the recently recomputed cluster membership pattern
然后反反复复直到数据点归宿稳定•
然后反反复复直到数据点归宿稳定•
Then we repeat steps E-M until the model matches the data closely enough (or until the data point assignments stabilize)
EM算法最后也能保证收敛,但是不能保证收敛在全局最优解
在高纬度情况下有没有过拟的危险?多少个k最合适?
Occam’s Razor:
Other things being equal, simple theories are preferable to complex ones
Other things being equal, simple theories are preferable to complex ones
Minimum Description Length principle (MDL)
postulates selecting models that need the smallest amount of memoryto encode:Minimize the sum of the following two factors:
– Amount of memory required to describe the data using the model
加上
– Amount of memory required to describe the model and its parameters
– Amount of memory required to describe the model and its parameters
高斯参数的数量随着维度的增加,增加的飞快;很容易增加过拟的危险,降低模型的显著性
The number of Gaussian Mixture parameters to fit grows very fast with the dimensionality of the data space; It results in an increased risk of over-fitting and it could reduce statistical significance of the learned models
控制方法
– Put constraints on the shapes of the covariances (e.g. restrict analysis to diagonal matrices only, etc.) ????不懂诶
– Reduce dimensionality of data (using feature selection & reduction beforehand) 降维
– Exploit structural dependencies between attributes of data 找出属性之间的依赖
E.g. using Bayesian Networks, Gaussian Mixture Trees, or other Graphical Models (some of these will be covered in the follow-up course


 1787
1787


 被折叠的 条评论
为什么被折叠?
被折叠的 条评论
为什么被折叠?
 到【灌水乐园】发言


